April confirmed the Q1 pattern: the Baltic states are facing a common fuel shock, but inflation is still moving through different national price structures.
In all three Baltic states, transport and fuel prices were again among the strongest contributors to inflation. But the same external pressure did not produce the same national result.
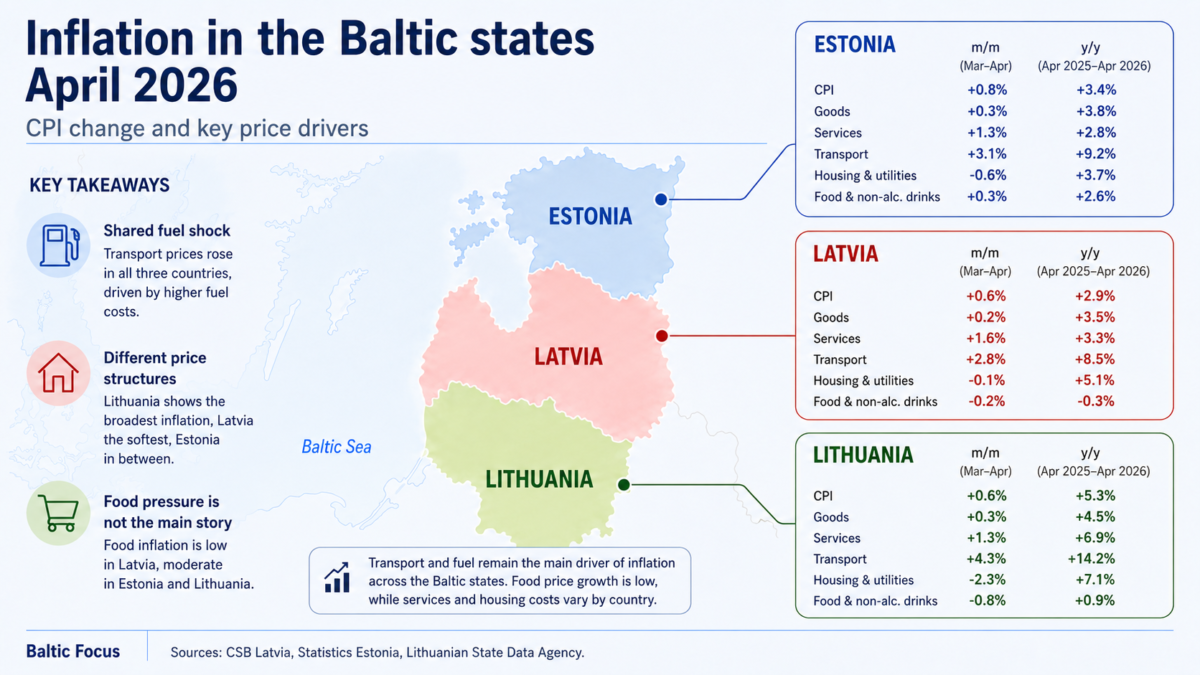
| April 2026 | Estonia | Latvia | Lithuania |
|---|---|---|---|
| CPI, y/y | 3.4% | 2.9% | 5.3% |
| CPI, m/m | 0.8% | 0.6% | 0.6% |
| Transport, y/y | 9.2% | 8.5% | 14.2% |
| Transport, m/m | 3.1% | 2.8% | 4.3% |
| Housing and utilities, y/y | 3.7% | 5.1% | 7.1% |
| Housing and utilities, m/m | −0.6% | −0.1% | −2.3% |
| Food and non-alcoholic drinks, y/y | 2.6% | −0.3% | 0.9% |
| Food and non-alcoholic drinks, m/m | 0.3% | −0.2% | −0.8% |
The category breakdown shows where the April pressure differs most clearly.
Lithuania entered Q2 with the broadest inflation pressure. Annual CPI reached 5.3%, transport prices were up 14.2%, services rose strongly, and housing-related costs increased 7.1%. This is not just a fuel story: the pressure is spread across several large spending categories.
The Lithuanian pattern also fits the latest forecasts from Lietuvos bankas and Swedbank, which see Lithuania facing the strongest inflation pressure in the Baltic region this year. The main driver is higher energy prices, but domestic factors are also part of the picture. Lietuvos bankas points to second-pillar pension withdrawals and higher indirect taxes as additional inflationary factors.
Latvia remained the softest case. Annual inflation stood at 2.9%, while food and non-alcoholic drink prices were still slightly lower than a year earlier. Transport and housing costs were rising, but the overall inflation profile remained less broad than in Lithuania.
Estonia stood between the two. Annual inflation was 3.4%, but the monthly increase was the strongest in the region at 0.8%. Transport prices rose 9.2% year-on-year, while food prices were up 2.6%.
Food prices did not drive the April inflation picture. Latvia had a small annual decline in food and non-alcoholic drink prices, Lithuania recorded a monthly fall, while Estonia showed a moderate annual increase. The main regional signal remained elsewhere: fuel, transport and energy-linked costs.
The April data therefore does not overturn the Q1 picture. It makes it clearer. Baltic inflation is not converging into one regional pattern. Q2 begins with a common fuel shock, but the national price structures remain different: broader pressure in Lithuania, softer inflation in Latvia, and a middle position in Estonia with a sharper monthly move.
Broader regional forecasts point in the same direction. SEB’s May Nordic Outlook frames the current shock as an energy-driven inflation impulse linked to the Middle East conflict, while noting that the effect on core inflation and growth remains uncertain and is not expected to repeat the 2021–2022 inflation shock.
Sources: Statistics Estonia, Central Statistical Bureau of Latvia, Lithuania’s State Data Agency, Lietuvos bankas, SEB, Swedbank.