Baltic labour markets split in Q1
In the first quarter of 2026, Baltic unemployment rates looked similar at the headline level. Unemployment stood at 7.1% in Estonia, 7.1% in Latvia and 7.4% in Lithuania.
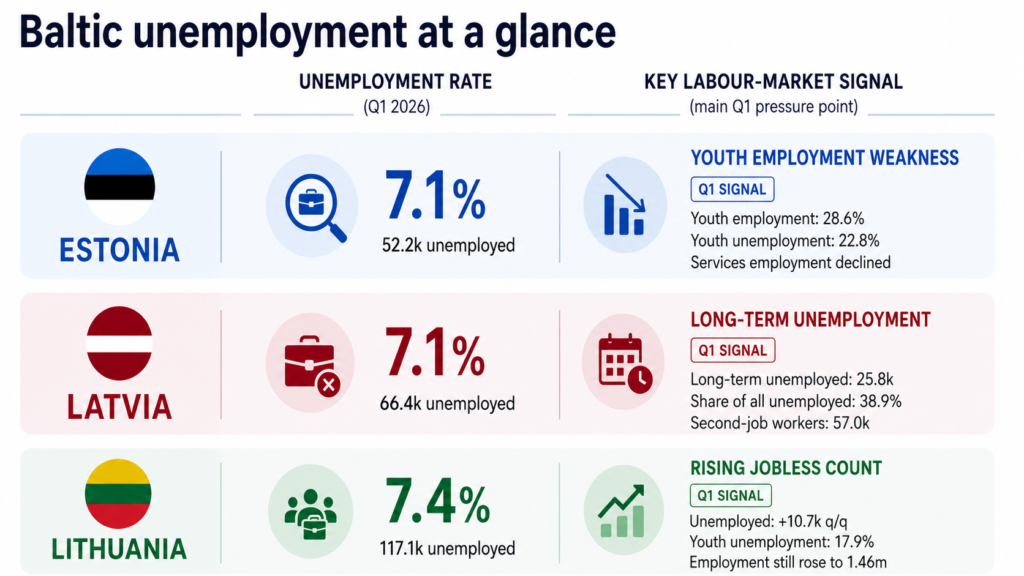
Estonia’s youth employment fell, Latvia’s long-term unemployment rose, and Lithuania’s number of unemployed increased.
In the first quarter of 2026, Baltic unemployment rates looked similar at the headline level. Unemployment stood at 7.1% in Estonia, 7.1% in Latvia and 7.4% in Lithuania.
But the similarity is limited. Under the same 7% unemployment range, the three countries are showing different labour-market signals. Estonia’s pressure point is youth employment and weaker services-sector demand. Latvia’s headline youth figures improved, but long-term unemployment and second-job work increased. Lithuania saw unemployment rise even as employment and the labour force expanded.
The second quarter will matter. By mid-year, it should become clearer which of these Q1 movements were temporary quarterly signals — and which are turning into broader labour-market trends.
Estonia: youth employment weakens as services lose workers
Estonia’s Q1 data showed unemployment at 7.1%, employment at 68% and labour force participation at 73.2%. Compared with the same period last year, the indicators improved. Compared with the previous quarter, however, they weakened.
The internal picture matters more than the headline rate. Employment continued to fall in the services sector, which Statistics Estonia linked to weak domestic demand. At the same time, employment increased in industry and construction.
The clearest warning sign is among young people. The employment rate for 15–24-year-olds fell to 28.6%, its lowest first-quarter level since 2011. Youth unemployment reached 22.8%.
For Estonia, the Q2 question is whether this was only a temporary services-sector pause — or a more persistent problem with young people entering the labour market.
Latvia: youth figures improve, but long-term unemployment rises
Latvia’s headline unemployment rate was also 7.1% in Q1. The employment rate among 15–74-year-olds stood at 63.8%, while in the 20–64 age group it was 77.3%. The annual picture remained relatively stable, but compared with Q4 2025, both the employment rate and the number of employed people declined.
Latvia’s youth figures moved in the opposite direction from Estonia’s. Youth employment rose to 31.6%, while youth unemployment fell to 9.4%, the lowest level in 18 years. The number of employed young people reached 59.6 thousand, up 7.3 thousand from a year earlier and 5.1 thousand from the previous quarter.
This makes Latvia the youth-market outlier in the Q1 Baltic picture. But the signal needs confirmation. Youth labour-market indicators can move sharply from quarter to quarter, especially in a smaller age group. Q2 data will be needed to show whether this was a real improvement in youth absorption into work, or a temporary quarterly movement.
Latvia’s weaker signals are elsewhere. Long-term unemployment rose to 25.8 thousand people, or 38.9% of all unemployed. The number of people working an additional job also rose to 57.0 thousand, or 6.5% of all employed people. That was a sharp increase: +26.3% from the previous quarter and +10.0% year-on-year.
This does not automatically mean a labour-market crisis. But at this scale and with this quarterly increase, second-job work is not a neutral flexibility signal either. It suggests that part of the employed population may be relying more heavily on additional work to support income.
For Latvia, the Q2 question is whether the strong youth figures hold — and whether long-term unemployment and additional work remain contained.
Lithuania: employment rises, but unemployment rises too
Lithuania had the highest Q1 unemployment rate among the three Baltic countries, at 7.4%. Unlike Latvia, unemployment increased both quarter-on-quarter and year-on-year. The number of unemployed people reached 117.1 thousand, up 10.7 thousand from the previous quarter and 10.6 thousand from a year earlier.
Youth unemployment also rose sharply. It reached 17.9%, increasing by 5 percentage points from the previous quarter and 4.7 percentage points from a year earlier.
But Lithuania is not simply showing a weak labour market. Employment also increased. The number of employed people rose to 1.46 million, up 3.0 thousand from the previous quarter and 13.2 thousand from a year earlier. At the same time, the labour force expanded by 13.6 thousand from Q4 2025.
That arithmetic matters. Almost all of the quarterly increase in the labour force was absorbed either into employment or unemployment: employment rose by 3.0 thousand, while unemployment rose by 10.7 thousand. This makes Lithuania’s Q1 signal different from a simple employment decline. More people were in the labour market, but job growth did not absorb the full increase.
For Lithuania, the Q2 question is whether rising unemployment was a temporary effect of stronger labour-force participation — or an early sign of mismatch between available workers and available jobs.
Youth labour market: Latvia is the outlier
Youth labour-market data show the clearest divergence between the three Baltic countries.
In Estonia, youth employment fell to 28.6% and youth unemployment reached 22.8%. In Lithuania, youth unemployment rose to 17.9%. Latvia moved in the opposite direction: youth employment rose to 31.6%, while youth unemployment fell to 9.4%, the lowest level in 18 years.
This is one of the most important Q1 signals, but also one that should be treated carefully. It may reflect stronger absorption of young people into work. It may also reflect demographic, participation or quarterly effects that need confirmation in the next data release.
For now, Latvia stands out from the regional pattern. Estonia and Lithuania show pressure in youth unemployment or youth employment. Latvia shows improvement — but the durability of that improvement is still untested.
Data card: Q1 2026
| Indicator | Estonia | Latvia | Lithuania |
|---|---|---|---|
| Unemployment rate | 7.1% | 7.1% | 7.4% |
| Employment rate | 68.0% | 63.8% / 77.3% for 20–64 | 73.7% for 15–64 |
| Youth unemployment | 22.8% | 9.4% | 17.9% |
| Main Q1 signal | Youth and services weakness | Long-term unemployment and second jobs | Labour force expands, unemployment rises |
| What to test in Q2 | Temporary weakness or trend | Youth improvement and labour-market depth | Participation effect or mismatch |
Bottom line
The Baltic labour-market story in Q1 2026 is not one shared unemployment story. It is three different signals beneath similar headline rates.
Estonia needs to show whether youth employment can recover.
Latvia needs to show whether its strong youth figures are durable, while long-term unemployment and second-job work remain contained.
Lithuania needs to show whether rising unemployment is mainly the cost of higher labour-force activity — or the beginning of a broader mismatch.
By the half-year mark, the signal should be clearer.
Method note. The Q1 labour-market data show why regional interpretation matters. A simple cross-country summary would stop at similar unemployment rates near 7%. But the more important signals sit below the headline: different age groups, youth labour-market divergence, second-job dynamics, long-term unemployment and labour-force changes. These require editorial judgement, not only extraction.