May and early June showed a more complex Baltic electricity market: more solar, weaker hydro and wind, a visible Estonia–Latvia bottleneck, and battery storage beginning to reshape the daily price curve.
Signal card
The Baltic power market is not moving as one.
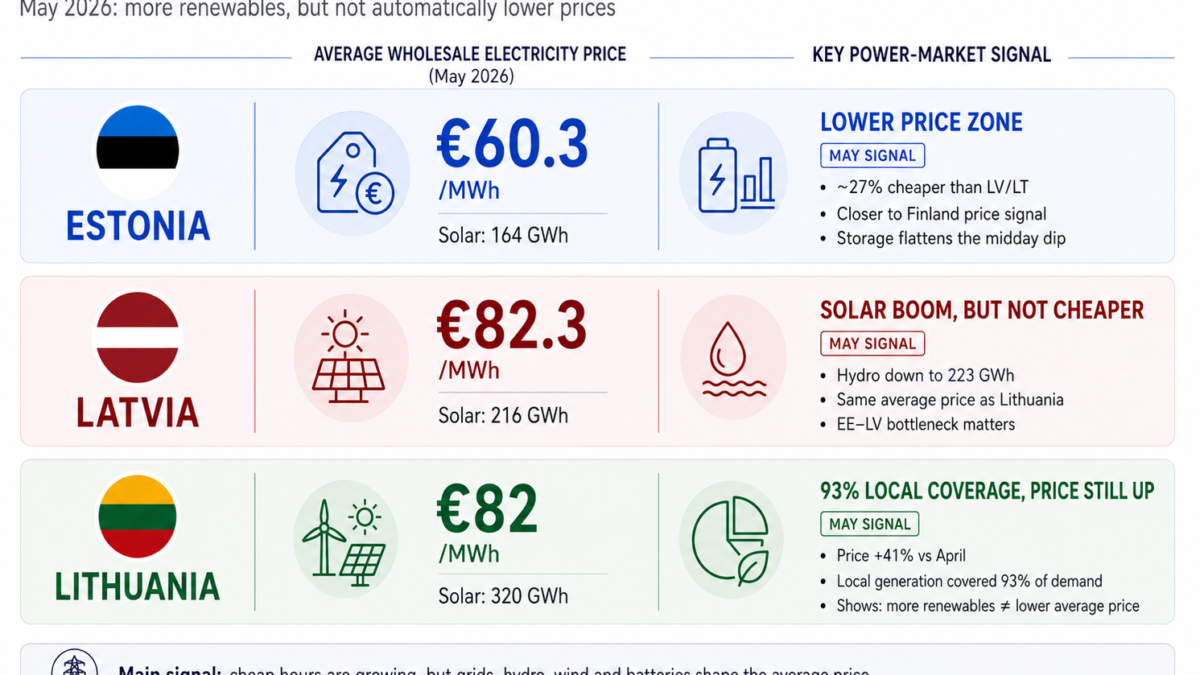
- Estonia’s average wholesale electricity price in May: EUR 60.3/MWh
- Latvia and Lithuania in May: EUR 82.3/MWh
- Lithuania’s local generation covered 93% of national electricity demand in May
- Lithuanian solar generation rose to 320 GWh
- Latvian solar generation reached almost 216 GWh
- In early June, weekly prices in Latvia and Lithuania rose to nearly EUR 98/MWh
- New announced battery storage in Latvia: 490 MWh from Rolls-Royce Power Systems and Sunly
The signal is not that renewables failed. The signal is that renewable generation alone no longer explains the price.
The Baltic market is moving from a simple generation story to a flexibility market: grid capacity, balancing reserves, hydro dispatch, battery storage and the ability to shift electricity between low-price and high-price hours are becoming central to price formation.
One region, two price realities
The headline May price split was clear.
Price card — May 2026
- Estonia: EUR 60.3/MWh
- Latvia: EUR 82.3/MWh
- Lithuania: EUR 82.3/MWh
- Estonia was about 27% cheaper than Latvia and Lithuania.
- Latvia and Lithuania were about 36% more expensive than Estonia.
ERR, citing Eesti Energia’s market review, linked the difference to maintenance on Estonia–Latvia transmission lines. The works limited the volume of cheaper Nordic electricity that could move south through Estonia into Latvia and Lithuania.
Litgrid described the same market split from the Lithuanian side. According to Lithuania’s transmission system operator, limited connections between Estonia and Latvia effectively divided the Baltic states into two price realities: Estonia was more closely linked to Finland, while Latvia and Lithuania were more exposed to the southern Baltic and Swedish price logic.
Cable maintenance explains part of the May episode. But the broader Estonia–Latvia bottleneck is not only a one-month story. It has been visible in early-2026 market data and is already shaping the regional price map.
Early-June data added another important detail. Latvenergo, in data reported by LETA, said that price differences between the Baltic countries were affected not only by planned Estonia–Latvia interconnection maintenance, but also by the partial reservation of transmission capacity for balancing services needed to ensure frequency stability.
That makes the Estonia–Latvia corridor not only a grid-maintenance issue, but part of the wider flexibility and system-stability story.
For investors and policymakers, this is the first signal: the Baltic states may be synchronised and integrated, but they do not always form prices as a single regional market.
High local generation did not prevent a price rise
Lithuania is the clearest example of why the old formula “more local generation means lower prices” is too simple.
Lithuania card — May 2026
- Average wholesale price: EUR 82/MWh
- Monthly increase from April: +41%
- Electricity demand: about 1,012 GWh
- Local generation: about 945 GWh
- Share of demand covered by local generation: 93%
- Solar generation: 320 GWh, up 57% from April
Litgrid’s data show the contradiction very clearly. Lithuania met almost all of its electricity demand from local generation in May, while solar production increased strongly. Yet the average wholesale price still rose by 41%.
That is not a paradox if the market is read hour by hour rather than through monthly totals.
Solar lowers prices mainly in the middle of the day. It does much less for mornings, evenings and low-wind periods. Monthly prices are shaped not only by how much electricity is produced locally, but also by when it is produced, where it can flow and what replaces it when renewable output is lower.
Solar is now large enough to matter
The Baltic solar numbers are no longer marginal.
Solar card — May 2026
- Lithuania: about 320 GWh
- Latvia: almost 216 GWh
- Estonia: about 164 GWh
- Latvia’s solar generation from March to May was roughly 182% higher than in the same period last year, according to Eesti Energia’s market review reported by ERR.
This changes the Baltic power market. In Latvia, solar output in May was already close to hydro output. Eesti Energia’s review, reported by ERR, put Latvian hydro generation at about 223 GWh in May.
That comparison matters. Solar is no longer just an additional green layer. In strong solar months, it is becoming a major part of the daytime supply stack.
But solar does not provide the same kind of flexibility as hydro. It is concentrated in specific hours. Its strongest effect is to push down midday prices, not to solve the whole monthly price curve.
Hydro and wind moved the other way
The May price rise was also driven by the fall in flexible and variable renewable generation.
Hydro and wind card — May 2026
- Latvian hydro output fell to about 223 GWh, nearly half the April level.
- Hydro’s share of Baltic consumption fell from almost a quarter in April to about 14% in May.
- Baltic wind generation fell from 664 GWh in April to 549 GWh in May.
Eesti Energia’s market review, reported by ERR, pointed to both factors: lower Latvian hydro after the spring flood period and weaker wind across the Baltic region.
This is important because Latvian hydro is not only generation. It is flexible, relatively cheap electricity that helps the regional market when wind and solar are weaker. When that hydro flexibility declines, the market becomes more exposed to other sources of balancing.
In some hours, the region had to rely more on controllable fossil-based generation. During the warm season, these plants may operate at a lower baseline load, which can make short-term starts more expensive.
That is why a greener system can still produce higher average prices in a particular month.
Early June confirmed the same pattern
The first week of June did not reverse the May signal. It confirmed it.
Early June card — previous week
- Latvia’s average weekly electricity price rose by 42% to EUR 97.55/MWh
- Lithuania’s price also rose by 42% to EUR 97.71/MWh
- Estonia’s weekly price doubled to EUR 77.70/MWh
- Baltic wind generation fell by 54% week on week
- Baltic solar generation still grew by 4%
- Baltic generation covered 83% of regional consumption
According to Latvenergo data reported by LETA, the price increase was driven mainly by very low wind generation. Wind output in the Baltic states fell to the second-lowest weekly level this year. Solar generation in the wider Nord Pool region declined, while Baltic solar output continued to grow, but not enough to materially limit the price increase.
This is a useful confirmation of the May signal.
More solar can soften prices in some hours. But low wind, reduced flexible supply, interconnector limits and balancing needs can still lift the average price sharply.
Batteries are becoming the missing price layer
The new element is battery storage.
ERR reported in early June that the difference between morning and evening peak prices and midday prices has become smaller this year than in previous years. Enefit linked this flatter U-shaped daily price curve to growing storage capacity.
Storage price card
- Strong solar normally pushes midday prices down.
- More batteries absorb part of that midday surplus.
- As a result, prices may stay above zero more often.
- The low-price signal becomes less visible in the spot price, but more valuable as a storage and balancing asset.
This is a crucial shift. If midday prices do not fall to zero, it does not necessarily mean that solar generation is weak. It may mean that the system is no longer seeing visible overproduction because storage is absorbing part of the surplus.
For battery owners, cheap midday electricity is not only a consumer benefit. It is an input.
The commercial value comes from storing electricity when the system has surplus supply and selling flexibility when the system needs it more — through balancing services, intraday trading, peak-hour price spreads or hybrid-park optimisation.
The same logic is visible on the grid side. Part of available cross-border capacity can be reserved for balancing services and frequency stability. Flexibility is therefore not only a battery-owner business model. It is also becoming embedded in how transmission capacity is allocated and priced.
This is why more storage can make the system more stable while also making the cheapest spot-price hours less visible. The benefit does not disappear, but it is redistributed through the flexibility market before it is reflected in average prices or final consumer bills.
A communication risk for the transition
This also creates a communication risk.
Public debate has often presented renewables as a direct route to cheaper electricity. The May and early-June data show a more complicated outcome: renewables create cheaper hours, while grids, balancing reserves, storage and interconnection capacity decide how much of that benefit is reflected in the average wholesale price and the final consumer bill.
No single actor fully owns this gap between the public promise and the market design. Governments frame the transition, TSOs manage system constraints, regulators oversee market rules, investors build flexibility assets, and retailers pass costs and prices through to consumers.
That does not mean the transition is failing. It means the public price promise has become too simple for the market that is now emerging.
The investment market has already moved
Battery storage is no longer only a technical add-on for synchronisation with continental Europe. It is becoming a Baltic investment market.
BESS investment card
- Rolls-Royce Power Systems and Sunly announced four large-scale battery storage systems in Latvia.
- Total announced capacity: 490 MWh
- The first hybrid energy park is planned in Valmiera in 2027.
- Rolls-Royce said its Baltic battery storage projects will exceed 1,500 MWh after current projects are completed.
This investment signal is important because it shows how the market is reading the same data.
The value is no longer only in producing more electricity. It is in controlling when electricity is stored, released and sold as flexibility.
In the next Baltic power-market phase, batteries, interconnectors and balancing services may matter as much as new renewable generation capacity.
What May and early June tell us
The data do not show that renewables failed. They show that the Baltic electricity market has moved into a more complex stage.
The simple formula “more renewables mean lower prices” is no longer sufficient.
A better formula is this:
More renewables mean more low-price hours, more need for flexibility, more value in storage and grids — but no automatic guarantee of lower average electricity prices.
The Baltic market is getting greener. It is not getting simply cheaper.
The next question is not only who builds generation. It is who provides, reserves and monetises flexibility: TSOs through balancing markets, frequency-stability needs and grid planning; hydro operators through dispatchable supply; battery owners through storage and price arbitrage; and consumers or industry through demand response.
That is where the next layer of Baltic power-market value will be created.
Sources: Litgrid; ERR / Eesti Energia; Latvenergo; Rolls-Royce Power Systems / Sunly.