Statistic · Agriculture & Food
Baltic agriculture 2025: Latvia has the eggs, Estonia has the dairy cows, Lithuania has the scale
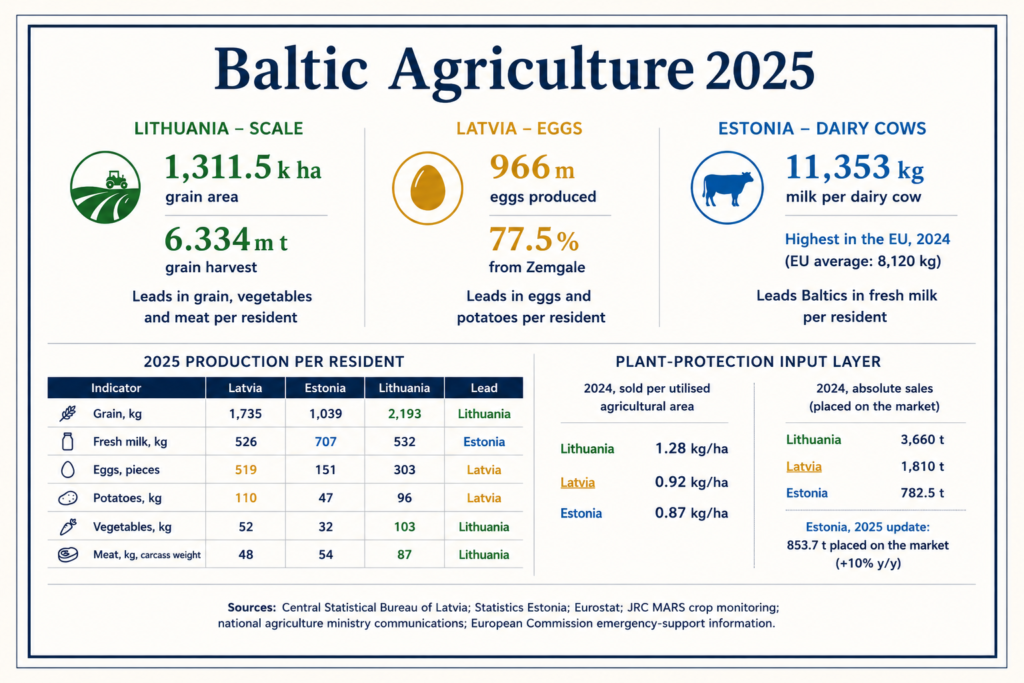
The Baltic states share a region, but not one agricultural model. Latvia stands out in egg production, Estonia through high-yield dairy cows, while Lithuania has the broadest agricultural scale.
The Baltic states are one regional economic space, but their agriculture does not follow one model.
The 2025 data show an asymmetric map. Lithuania is the broadest agricultural economy in the region, leading in grain, vegetables and meat production per resident, as well as in grain area and harvest volume. Latvia’s standout position is eggs: it produced 966 million eggs in 2025, with 77.5% of that output concentrated in Zemgale. Estonia’s dairy profile is less about having the largest cattle herd and more about high-yield dairy cows.
Eurostat’s 2024 dairy comparison placed Estonia at the top of the EU for apparent annual milk yield, with 11,353 kg per dairy cow, compared with an EU average of 8,120 kg.
Lithuania is the scale economy of Baltic agriculture. In 2025, it had 1,311.5 thousand hectares of grain crops and a 6.334 million tonne grain harvest. Latvia followed with 757.7 thousand hectares and 3.197 million tonnes, while Estonia had 346.6 thousand hectares and 1.259 million tonnes.
Scale matters because it changes the operating environment: larger crop areas and harvest volumes support different logistics, storage, processing, export capacity, machinery use, credit needs and input demand. Lithuania is therefore not just a larger version of the same Baltic farm profile; it has a different agricultural base.
Baltic agriculture is not one model
Lithuania — scale
1,311.5k ha grain area
6.334m t grain harvest
Leads in grain, vegetables and meat per resident
Latvia — eggs
966m eggs produced
77.5% from Zemgale
Leads in eggs and potatoes per resident
Estonia — dairy cows
11,353 kg milk per dairy cow
Highest apparent annual yield in the EU, 2024
Leads Baltics in fresh milk per resident
Small note inside card:
Selected agricultural indicators. Production per resident is not consumption or self-sufficiency.
Production per resident: useful, but limited
The per-resident comparison shows where each country stands out relative to its population. In 2025, Lithuania led Latvia and Estonia in grain, vegetables and meat production per resident. Latvia led in potatoes and eggs. Estonia had the highest fresh milk production per resident.
| 2025 production per resident | Latvia | Estonia | Lithuania | Lead |
|---|---|---|---|---|
| Grain, kg | 1,735 | 1,039 | 2,193 | Lithuania |
| Fresh milk, kg | 526 | 707 | 532 | Estonia |
| Eggs, pieces | 519 | 151 | 303 | Latvia |
| Potatoes, kg | 110 | 47 | 96 | Latvia |
| Vegetables, kg | 52 | 32 | 103 | Lithuania |
| Meat, kg, carcass weight | 48 | 54 | 87 | Lithuania |
But these figures are not a clean food-security ranking. Production per resident is not consumption. It does not show what households eat, how much is exported, how much is imported, or whether a country is self-sufficient in a product group.
The 2025 figures should also be read against a difficult recent climate background. Since 2022, Baltic agriculture has faced repeated weather pressure: drought, excessive rainfall, spring frosts, flooded fields and harvest-quality problems. In 2025, all three Baltic states again faced significant weather-related agricultural disruption. The point is not to explain every country ranking by weather, but to show that the 2025 figures are not coming from a stable baseline.
Latvia’s crop-side weakness is visible in the longer comparison. Production per resident fell from 199 kg of potatoes in 2020 to 110 kg in 2025, from 84 kg of vegetables to 52 kg, and from 10 kg of fruit and berries to 6 kg. Over the same period, fresh milk edged up from 521 kg to 526 kg per resident, while eggs increased from 422 to 519 pieces.
Input background: plant-protection products
Plant-protection products add one more background signal. The latest aligned Baltic comparison is for 2024: sales per utilised agricultural area were 1.28 kg/ha in Lithuania, 0.92 kg/ha in Latvia and 0.87 kg/ha in Estonia.
The indicator should be read carefully: it measures products placed on the market, not necessarily applied on fields in the same year, and may include some non-agricultural uses. Still, it suggests that Lithuania’s larger crop scale also comes with a higher input-intensity background.
Plant-protection input layer
2024, sold per utilised agricultural area
Lithuania — 1.28 kg/ha
Latvia — 0.92 kg/ha
Estonia — 0.87 kg/ha
2024, absolute sales
Lithuania — 3,660 t
Latvia — 1,810 t
Estonia — 782.5 t
Estonia, 2025 update
853.7 t placed on the market
+10% year-on-year
Small note inside card:
Placed on the market, not necessarily applied on fields in the same year.
Reading the map
The result is not a regional average, but an asymmetric structure: Lithuania carries the broadest crop-and-meat scale; Latvia’s egg position is real in absolute production; Estonia’s dairy profile rests on high-yield dairy cows.
The 2025 Baltic agriculture map is therefore a map of different production bases, not one shared farm model.