Baltic retail in August 2026: the headline ranking reverses on a two-year view

Estonia led August growth, but Lithuania still leads the accumulated rise
The August retail figures produce a simple Baltic ranking. Real retail sales volumes were 6% higher year on year in Estonia, 3.7% in Lithuania and 3.5% in Latvia.
Extend the comparison back one more year, however, and the ranking reverses.
Lithuanian retail volumes were already 6.4% higher in August 2025, Latvian volumes 4.3% higher, while Estonia was 2% below the previous year. Compounding the annual changes puts Lithuania roughly 10.3% above August 2024, Latvia about 8.0% above, and Estonia only around 4% above.
The country with the strongest August headline therefore has the weakest accumulated increase of the three.
Real retail sales volume
| Estonia | Latvia | Lithuania | |
|---|---|---|---|
| August 2026, y/y | +6% | +3.5% | +3.7% |
| August 2025, y/y | −2% | +4.3% | +6.4% |
| Approx. change from August 2024 | ~+4% | +8.0% | +10.3% |
| August 2026 vs July, seasonally adjusted | +1% | −1.4% | +0.1% |
The two-year figures are a robustness check on annual base effects, not a measure of an underlying trend. Estonia’s published annual changes are rounded to whole percentages, so its compounded figure should also be read as approximate.
Estonia: a strong headline, but no clear acceleration
Estonia’s 6% annual increase is the strongest of the three Baltic figures. Manufactured-goods retail rose 8%, food-store volumes 3% and sales volumes at automotive-fuel retailers 5%. Seasonally and working-day adjusted retail volume also increased 1% from July, so August was not simply a statistical artefact.
But the annual comparison benefits substantially from the base.
Retail volume had increased 1% year on year in July 2025 before falling 2% in August. Manufactured-goods sales similarly moved from +3% in July 2025 to −2% in August.
That matters when comparing this summer’s headlines. July 2026 was reported at +4% and August at +6%, yet compounding the two annual changes puts both months only around 4–5% above their respective 2024 levels. Given that the Estonian rates are published as rounded whole percentages, the difference between those two compounded estimates is too small to support a claim that underlying retail demand accelerated.
Estonia therefore gives a mixed signal: retail improved from July on a seasonally adjusted basis, but the jump in the annual growth rate exaggerates the change in momentum.
The standard VAT rate did rise from 22% to 24% on 1 July 2025. That is relevant context for both comparison months, but the data do not isolate a VAT effect and it cannot explain why August 2025 was weaker than July on its own. It should therefore remain context rather than the explanation for the August result.
Latvia: the apparent slowdown is mostly a base effect
Latvia appears to have suffered the opposite move: annual retail growth fell from 7% in July to 3.5% in August.
The two-year comparison makes the slowdown look much less dramatic.
July 2025 retail had increased only 1.7% year on year. August 2025 was much stronger at 4.3%, with non-food sales excluding fuel up 9.4%.
Compounding the figures puts July 2026 roughly 8.8% above July 2024 and August roughly 8.0% above August 2024. Most of the fall from a 7% annual headline to 3.5% therefore reflects a tougher comparison month rather than a comparable collapse in the level of retail activity.
There was still genuine cooling. Seasonally adjusted retail volume fell 1.4% from July, including declines of 1.1% in non-food retail and 4.3% at automotive-fuel retailers. The coincidentally identical 4.3% figures elsewhere in the Latvian data are not typos: August 2025 total growth was +4.3%, August 2026 fuel retail was +4.3% year on year and fuel retail fell 4.3% month on month.
Latvia also changed the price environment for households in July. A temporary 12% VAT rate took effect for specified bread, milk, poultry and eggs from 1 July 2026 to 30 June 2027. By August, food and non-alcoholic beverage prices were 4% below their level a year earlier.
That tax change does not artificially raise a constant-price retail volume index. It is better treated as part of the household purchasing-power backdrop.
The Latvian reading is therefore more modest than either headline suggests: not the 7% surge implied by July, but not the abrupt slowdown implied by August either.
Lithuania: the modest headline sits on the strongest base
Lithuania is the most striking reversal.
Its 3.7% annual increase looks unremarkable beside Estonia’s 6%. But August 2025 had already produced 6.4% growth. Over two years, total retail is therefore roughly 10.3% higher, the largest accumulated increase of the three Baltic states.
Non-food retail is stronger still. August 2026 volumes were 9.2% above a year earlier after an increase of about 14.9% in August 2025, implying cumulative growth of roughly 25.5% over two years.
That strength cannot be treated simply as an August pension-withdrawal effect.
Lithuania’s second-pillar reform is clearly large enough to affect household spending. The Bank of Lithuania estimates that €3.5 billion had been transferred to households and that around one fifth of withdrawn funds may have been spent on goods and services. It estimates €0.5–0.7 billion of additional spending between April and June, with goods accounting for around 85% of the identified amount. Home improvements, furniture, household goods and cars were among the strongest categories.
But the same central-bank analysis contains the reason not to make the causal claim too strong: expenditure above its usual path was already visible in March 2026, before the pension money was paid out. The report does not identify exactly why spending moved early; anticipation of the forthcoming withdrawals is one possible mechanism, but it is not established by the data.
The broader retail data also show that strong Lithuanian non-food demand did not suddenly appear in August. Non-food volumes were already up 15.3% year on year in May and 12.5% in June.
Pension withdrawals are therefore best read as an additional boost to an already strong non-food market, not as a complete explanation for it.
August also shows why the 3.7% aggregate is much lower than the non-food number. Food retail increased only 0.8%, while automotive-fuel retail volumes declined 3.3%. Strong discretionary-goods sales were being offset by much weaker growth in large parts of the retail basket.
Read the level before ranking the growth rates
The August figures are positive in all three Baltic states, but their annual growth rates tell very different stories about where each market came from.
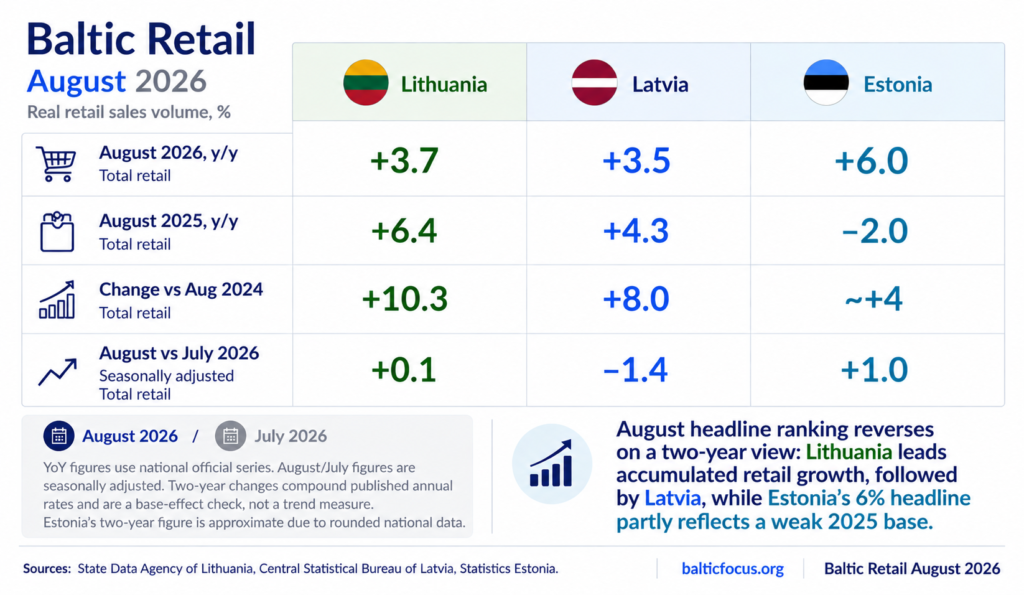
Estonia ranks first on the August headline but last on the two-year comparison. Lithuania ranks only second in the headline and first over two years. Latvia remains between them.
That does not make the two-year comparison a new “true” trend. August 2024 is itself only another point in the cycle, and compounded annual rates are a simple check rather than a substitute for a seasonally adjusted volume index. Eurostat’s harmonised retail dataset provides precisely that type of series and is updated through August 2026.
But the exercise is enough to show why a single annual figure can mislead.
For the next monthly release, the useful questions are therefore different. Does Estonia maintain positive month-on-month momentum once the favourable annual comparison is less important? Does Latvia recover from August’s 1.4% monthly decline? And does Lithuania’s unusually strong non-food performance persist as the immediate pension-withdrawal impulse becomes less important?
Those tests will tell us considerably more about Baltic retail demand than another ranking of three year-on-year headline numbers.