Baltic Demography 2025: Low Births Keep Natural Decline in Place
Estonia and Latvia have published full-year 2025 demographic data, while Lithuania’s provisional demographic indicators show how the same pressures shaped the country at the turn of 2026.
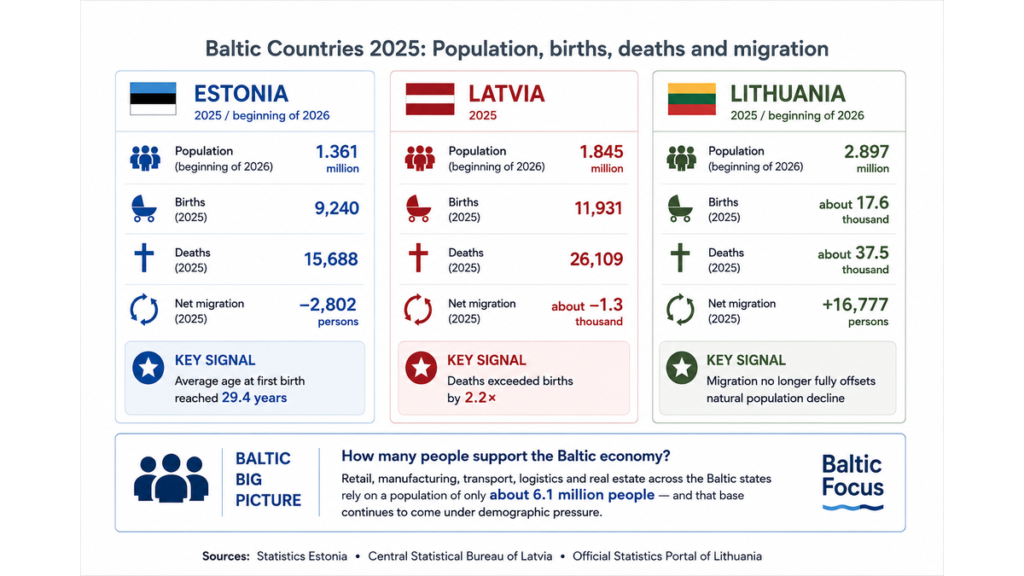
Estonia and Latvia have published full-year 2025 demographic data, while Lithuania’s provisional demographic indicators show how the same pressures shaped the country at the turn of 2026.
Demographic statistics published across the Baltic states point to a common trend: fewer children are being born while natural population decline continues. The latest figures do not mark a new demographic shock. They show that low births and natural decrease remain embedded features of the Baltic population picture.
But the three countries should not be forced into one artificial comparison table. The available data differ by period and depth, so the clearer approach is to read each country separately and then compare the underlying signals.
Estonia
Data card: Estonia 2025
Births: 9,240
Boys: 4,798
Girls: 4,442
Estonian children: 6,722 / 73% of births
Average age of mothers: 31.2
Average age at first birth: 29.4
Estonia recorded a new low in births in 2025, with only 9,240 children born. The decline has now continued for several years, after a previous decade in which Estonia usually recorded around 13,000–14,000 births annually.
Statistics Estonia’s survey adds a motive layer to the birth data. Among respondents, 34% cited age as a factor influencing whether they planned to have children in the next three years, 29% pointed to economic coping capacity, and 21% mentioned global problems such as instability or environmental concerns. Studies, job search, self-realisation or career were cited by 14%, while 14% mentioned the absence of a partner and 13% pointed to their own health problems.
The survey does not produce one dominant explanation. It shows a fragmented fertility constraint: age, income security, uncertainty, partnership and health all matter.
Marriage data add another layer. The share of children born to married parents rose to 47.7% in 2025, compared with 40.9% in 2010. This does not mean that marriage alone explains fertility, but it suggests that in a more uncertain environment some families may seek greater legal and social stability before having children.
Source: Statistics Estonia.
Latvia
Data card: Latvia 2025
Births: 11,931
Deaths: 26,109
Natural change: -14,178
Main signal: deaths more than twice births
Latvia’s 2025 demographic data point in the same direction as elsewhere in the Baltic states. With 11,931 births against 26,109 deaths, natural decrease remained substantial, reinforcing the region’s broader pattern of persistently low fertility and natural population decline.
Latvia’s role in this report is comparative. It shows that the demographic issue is not only about Estonia’s record-low births or Lithuania’s migration balance. The pressure is visible across the region.
Source: Central Statistical Bureau of Latvia.
Lithuania
Data card: Lithuania 2025 / beginning of 2026
Population, beginning of 2026: 2.897 million
Change vs beginning of 2025: +6.3 thousand
Live births, Dec 2025: 1,389
Deaths, Dec 2025: 3,438
Net migration, 2025: +16,777
Returning citizens among Dec 2025 immigrants: 36.8%
Lithuania’s provisional demographic indicators show a more complex population balance than births and deaths alone.
At the beginning of January 2026, Lithuania had 2.897 million residents, 6.3 thousand more than at the beginning of 2025. This makes Lithuania different from a simple natural-decrease story: low births and high deaths continued, but positive migration still supported the headline population figure.
In December 2025, Lithuania recorded 1,389 live births and 3,438 deaths. Compared with December 2024, births decreased by 115 babies, or 7.6%, while deaths increased by 103, or 3.1%.
Marriage and divorce data provide context, but not a simple explanation. In December 2025, Lithuania recorded 532 marriages, up by 26 couples, or 5.1%, compared with December 2024. Divorces rose by 53 couples, or 8.4%, to 682. These monthly figures should not be overread as a fertility explanation: marriage and divorce statistics capture legal status changes, including remarriages and separations, not a direct transition into first births.
Migration is the key Lithuanian buffer. In 2025, Lithuania recorded 47,639 immigrants and 30,862 emigrants, leaving positive net migration of +16,777. In December 2025 alone, 3.8 thousand people immigrated to Lithuania, while 1.5 thousand emigrated. Returning Lithuanian citizens accounted for 36.8% of December immigrants.
But the buffer is weakening. Net migration fell from +72,097 in 2022 to +44,994 in 2023, +23,140 in 2024 and +16,777 in 2025. Lithuania still benefits from migration, but less strongly than during the exceptional post-2022 period.
Official long-term projections still point to a smaller Lithuanian population later this century. However, the more important near-term signal is clearer: low births and natural decrease are still partly offset by migration, although the offset is narrowing.
Source: Official Statistics Portal of Lithuania. 2025 demographic indicators are provisional.
Baltic reading
Because Estonia and Latvia are discussed on full-year 2025 data, while Lithuania is read through provisional indicators for the beginning of 2026 and December 2025, this report compares signals rather than one-to-one annual totals.
The Baltic states share the same basic demographic problem: low births and continuing natural decrease. But the mechanisms differ.
Estonia provides the clearest official evidence on why people delay or avoid having children. Latvia shows one of the region’s sharpest natural-decrease pressures. Lithuania shows how migration can still cushion population decline, although that cushion has become smaller since 2022.
The stronger conclusion is not that the Baltics are simply “dying out”. The data point to a more precise reading:
Baltic demography is now shaped by three interacting forces: weak fertility, persistent natural decrease and uneven migration buffers.
Statistical residents and administrative registers
Population totals in the Baltic states can differ depending on whether the source counts statistical residents or people recorded in administrative registers.
At the beginning of 2026, Estonia’s two measures were almost aligned: Statistics Estonia reported 1,360,745 residents, while the Population Register counted 1,365,142 people — a gap of about 4,400.
In Latvia, the gap was much larger. CSB’s statistical resident population was about 1.845 million, while PMLP’s Physical Persons Register counted 1,988,792 persons linked to a Latvian residence record — roughly 144,000 more.
Lithuania shows a similar pattern. The statistical resident-population figure at the beginning of 2026 was about 2.897 million, while the population register counted roughly 3.044 million people — a gap of about 147,000.
This is why administrative register figures should not be read as direct population estimates. They can include people with formal residence links, declared addresses or residence permits who are not necessarily counted as usual residents under statistical methodology.