In March 2026, goods trade in the Baltic states looked more active than at the beginning of the year. Lithuania recorded a strong monthly rebound in both exports and imports. Latvia also increased its foreign trade turnover, while Estonia reported year-on-year growth in both exports and imports.
But the first-quarter picture is less straightforward. Lithuania’s total exports were still lower than a year earlier, and exports of Lithuanian-origin goods fell more sharply than total exports. Latvia’s trade turnover increased, but imports grew faster than exports. Estonia showed export growth, but first-quarter gains were strongly supported by re-exports, while exports of Estonian-origin goods remained broadly flat.
This article looks only at trade in goods. Services are not included, as they follow a different statistical logic and require a separate regional comparison.
Lithuania: March rebound, but weaker domestic-origin exports
| Lithuania, goods trade | March 2026 | Change |
|---|---|---|
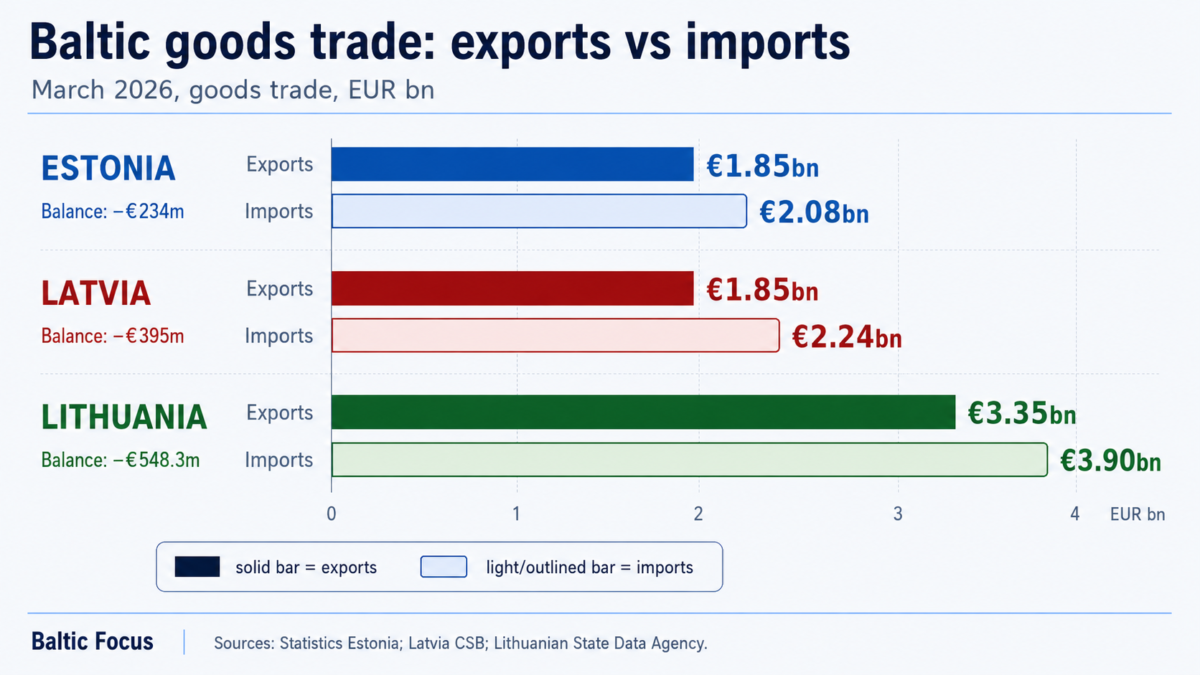
| Exports | €3.35bn | +2.7% y/y; +16.4% m/m |
| Imports | €3.90bn | –2.5% y/y; +15.5% m/m |
| Trade balance | –€548.3m | improved from –€737.0m y/y |
| Lithuanian-origin exports | €2.22bn | –0.9% y/y; +14.3% m/m |
| Lithuania, Q1 2026 | Value | Change y/y |
|---|---|---|
| Exports | €9.18bn | –1.6% |
| Imports | €10.52bn | –3.9% |
| Lithuanian-origin exports | €6.21bn | –4.8% |
| Trade balance | –€1.34bn | improved from –€1.62bn |
Lithuania’s March figures showed a clear rebound from February. Exports rose by 16.4% month-on-month, while imports increased by 15.5%. The monthly increase in exports was driven by mineral fuels and petroleum products, fertilisers and road vehicles. Import growth was supported by road vehicles, chemical products and electrical machinery.
However, the first-quarter picture was weaker. In January–March 2026, Lithuania’s exports fell by 1.6% year-on-year, while imports declined by 3.9%. The trade deficit narrowed, but mainly because imports fell faster than exports.
The more important signal is the decline in domestic-origin exports. Exports of Lithuanian-origin goods fell by 4.8%, and even excluding mineral products they were down by 3.1%. This suggests that Lithuania’s underlying export base remained under pressure despite the stronger March result.
What sold better: mineral fuels and petroleum products, fertilisers, road vehicles, electrical machinery.
What weakened: Lithuanian-origin mineral products, furniture, chemicals and cereals.
Lithuania’s trade map
| Main export destinations, Q1 2026 | Share of total exports |
|---|---|
| Latvia | 12.4% |
| Poland | 12.1% |
| Germany | 9.5% |
| Netherlands | 6.7% |
| Estonia | 5.6% |
| Main import sources, Q1 2026 | Share of imports |
|---|---|
| Poland | 14.0% |
| Germany | 13.1% |
| Latvia | 8.8% |
| Netherlands | 5.9% |
| Norway | 5.7% |
| China | 5.5% |
| Saudi Arabia | 4.9% |
Lithuania’s trade geography shows two different layers. In total exports, Latvia was the largest destination in the first quarter. But for Lithuanian-origin goods, the leading markets were Poland, Germany and the Netherlands, while Latvia ranked lower.
That distinction matters. Latvia is Lithuania’s largest destination for total exports, but not for Lithuanian-origin exports. This points to Lithuania’s role not only as a producer, but also as a regional distribution and re-export hub.
On the import side, Lithuania is anchored by Poland, Germany and Latvia. But the data also show a global raw-material and goods-origin layer. China accounted for 5.5% of imports, while Saudi Arabia accounted for 4.9%. Saudi Arabia should not be read as ordinary consumer trade. It is better understood through the oil and petroleum chain around ORLEN Lietuva’s Mažeikiai refinery, one of the key industrial and energy nodes in the Baltic region.
Latvia: higher turnover, but import-heavy growth
| Latvia, goods trade | March 2026 | Change |
|---|---|---|
| Exports | €1.85bn | +6.0% y/y; +19.1% m/m |
| Imports | €2.24bn | +11.4% y/y; +18.9% m/m |
| Total trade turnover | €4.09bn | +8.9% y/y |
| Export share in turnover | 45.2% | down from 46.4% y/y |
| Latvia, Q1 2026 | Value | Change y/y |
|---|---|---|
| Exports | €4.97bn | –1.7% |
| Imports | €5.87bn | +3.6% |
| Total trade turnover | €10.85bn | +1.1% |
Latvia’s March trade also increased, but the structure was less favourable. Exports rose by 6.0% year-on-year, while imports grew by 11.4%. As a result, the export share in total trade turnover fell from 46.4% to 45.2%.
For the first quarter, exports were still 1.7% lower than a year earlier, while imports were 3.6% higher. This means Latvia’s trade growth was import-heavy: the country traded more actively, but the balance deteriorated.
What Latvia sold and bought
| Main export groups, March 2026 | Share / signal |
|---|---|
| Wood and wood products | 14.4% of exports; –7.9% y/y |
| Mineral fuels and petroleum products | 11.5%; +15.6% y/y |
| Electrical machinery | 9.8%; +4.6% y/y |
| Road vehicles and parts | 5.3%; broadly flat |
| Machinery and mechanical appliances | 5.1%; +10.0% y/y |
| Alcoholic and non-alcoholic beverages | 4.0%; +33.9% y/y |
| Pharmaceuticals | 3.8%; +10.2% y/y |
Latvia’s export growth was supported by food industry products, mineral products, chemicals, machinery and electrical equipment. Food industry exports rose by €37.2m, mineral products by €29.0m, chemicals by €26.7m, and machinery and electrical equipment by €16.5m.
But the largest export group — wood and wood products — weakened. Its decline was driven especially by wood pellets. This is not just a Latvian issue: wood-related exports were also weak elsewhere in the region. Estonia reported a decline in wood and wood products, while Lithuania’s related furniture and wood-processing segment also contracted.
| Main import groups, March 2026 | Share / signal |
|---|---|
| Mineral fuels and petroleum products | 14.8% of imports; +58.2% y/y |
| Electrical machinery | 9.6%; –2.9% y/y |
| Road vehicles and parts | 9.1%; –7.2% y/y |
| Machinery and mechanical appliances | 8.4%; +13.9% y/y |
| Pharmaceuticals | 5.5%; +43.5% y/y |
| Plastics and plastic products | 3.7%; +9.1% y/y |
| Alcoholic and non-alcoholic beverages | 2.9%; +19.8% y/y |
On the import side, the strongest increase came from mineral products. Imports of mineral products rose by €123.0m, or 56.7%, while chemical products increased by €42.6m. The increase in mineral fuel and petroleum product imports was mainly linked to motor gasoline.
This is important for interpreting Latvia’s March numbers. The country did not simply “export more and import more”. It exported more in several groups, but the import side was driven strongly by energy and petroleum products.
Latvia’s trade map
| Main export destinations, March 2026 | Share of exports |
|---|---|
| Lithuania | 18.5% |
| Estonia | 11.7% |
| Germany | 6.4% |
| Sweden | 5.5% |
| Main import sources, March 2026 | Share of imports |
|---|---|
| Lithuania | 18.8% |
| Germany | 11.9% |
| Poland | 11.0% |
| Estonia | 9.1% |
Latvia’s own partner map is strongly Baltic. Lithuania and Estonia together accounted for around 30% of Latvia’s exports in March, while Lithuania was also Latvia’s largest import source.
There is also a politically sensitive detail in Latvia’s data. Russia stood out in March exports: exports to Russia rose by 35.2% year-on-year to €99.7m, or 5.4% of total exports. Imports from Russia, by contrast, fell to only €3.9m, or 0.2% of imports.
This does not look like a recovery of normal two-way trade. It looks like a narrow and highly asymmetric export channel. The increase was mainly linked to food industry products, especially strong alcoholic beverages.
Estonia: stronger headline growth, but re-export matters
| Estonia, goods trade | March 2026 | Change |
|---|---|---|
| Exports | €1.85bn | +8% y/y |
| Imports | €2.08bn | +6% y/y |
| Trade balance | –€234m | improved from –€268m y/y |
| Estonian-origin goods share | 65% | origin exports +8% y/y |
| Estonia, Q1 2026 | Value | Change y/y |
|---|---|---|
| Exports | €4.85bn | +4% |
| Imports | €5.77bn | +3% |
| Trade balance | –€923m | slightly worse than –€912m |
| Re-exports | — | +11% |
| Estonian-origin exports | — | broadly flat |
Estonia’s March figures looked stronger on the surface. In March 2026, Estonia exported goods worth €1.85bn and imported goods worth €2.08bn. Exports were 8% higher than a year earlier, while imports rose by 6%. The trade deficit narrowed to €234m, compared with €268m in March 2025.
The first-quarter picture, however, needs a caveat. Estonia’s exports increased by 4% year-on-year and imports by 3%, but the quarterly export growth was mainly driven by an 11% increase in re-exports. Exports of Estonian-origin goods remained broadly at last year’s level in the first quarter.
The re-export effect should be treated with caution. Statistics Estonia linked the increase especially to precious metals, including gold and investment coins. This is a high-value and volatile category. It can lift headline exports without necessarily indicating broader industrial momentum.
March itself looked somewhat healthier. Exports of Estonian-origin goods increased by 8% year-on-year, re-exports rose by 9%, and Estonian-origin goods accounted for 65% of total exports. This means Estonia’s trade improvement cannot be dismissed as only a re-export story, but neither can it be read as a broad industrial rebound.
What Estonia sold and bought
| Main export groups, March 2026 | Share / signal |
|---|---|
| Electrical equipment | 16% of exports; +26% y/y |
| Agricultural and food products | 11%; +2% y/y |
| Wood and wood products | 10%; –6% y/y |
| Mineral products | 10%; +9% y/y |
| Transport equipment | 10%; +7% y/y |
| Machinery and mechanical equipment | 8%; +18% y/y |
| Metals and metal products | 8%; +7% y/y |
Electrical equipment was Estonia’s strongest export signal in March. Its exports rose by 26%, supported especially by communication equipment. Machinery exports also increased by 18%, while transport equipment, mineral products and metals grew more moderately.
The weaker points were wood and wood products, down 6%, and optical, measuring and precision instruments, down 22%.
| Main import groups, March 2026 | Share / signal |
|---|---|
| Electrical equipment | 14% of imports; +21% y/y |
| Transport equipment | 13%; broadly flat |
| Agricultural and food products | 13%; +10% y/y |
| Machinery and mechanical equipment | 10%; +9% y/y |
| Metals and metal products | 9%; +36% y/y |
| Chemicals | 9%; +1% y/y |
| Mineral products | 7%; –28% y/y |
On the import side, Estonia bought more metals and metal products, electrical equipment, agricultural and food products, and machinery. The sharpest increase came from metals and metal products, up 36%, while electrical equipment imports rose by 21%.
Mineral product imports fell by 28%, mainly due to lower imports of natural gas and petroleum products.
Estonia’s trade map
| Main export destinations, March 2026 | Share / signal |
|---|---|
| Finland | 14%; –4% y/y |
| Latvia | 11%; +24% y/y |
| Lithuania | 9%; +21% y/y |
| Sweden | 9%; +14% y/y |
| Germany | 7%; –4% y/y |
| Netherlands | 6%; +90% y/y |
| Main import sources, March 2026 | Share / signal |
|---|---|
| Finland | 12%; +25% y/y |
| Germany | 11%; +2% y/y |
| Latvia | 10%; –15% y/y |
| Poland | 9%; +10% y/y |
| Lithuania | 9%; +2% y/y |
| Sweden | 8%; –2% y/y |
| China | 4%; +31% y/y |
| Switzerland | 3%; +41% y/y |
Estonia’s trade map is more northern than Lithuania’s. Finland is the leading partner, but Latvia ranks second in exports and third in imports.
The geography also adds nuance. Exports to Latvia and Lithuania grew strongly, while exports to Finland fell. Exports to the Netherlands jumped by 90%, but this was mainly because of higher exports of shale fuel oil. That makes it more of an energy-related spike than a broad market expansion.
On the import side, Finland remained the largest source. Imports from Finland rose by 25%, partly due to mineral products including electricity. Imports from Latvia fell by 15%, mainly because Estonia imported fewer mineral products, including natural gas.
Regional map: Latvia is not peripheral
| Latvia’s position in neighbours’ goods trade | Rank |
|---|---|
| In Lithuania’s total exports | No. 1 destination |
| In Estonia’s exports | No. 2 destination |
| In Lithuania’s imports | No. 3 source |
| In Estonia’s imports | No. 3 source |
The March and first-quarter data do not show a clean, broad-based Baltic trade recovery. They show three different trade stories.
Lithuania recorded a March rebound, but first-quarter exports were still lower than a year earlier, and Lithuanian-origin exports remained under pressure. Estonia showed stronger headline growth, but the quarterly increase was strongly supported by re-exports, including high-value financial-commodity flows such as precious metals, gold and investment coins. Latvia increased trade turnover, but imports grew faster than exports, and the trade balance worsened.
The commodity structure also points to a selective, not broad-based, recovery. Energy and petroleum products strongly affected Lithuania and Latvia. Re-exports shaped Estonia’s quarterly export performance. Electrical equipment was a positive signal in Estonia and Lithuania, while wood-related exports were weak across the region: directly in Latvia and Estonia, and through the related furniture and wood-processing segment in Lithuania.
The geography of trade is just as important as the growth rates.
Lithuania’s trade map is anchored by Poland, Germany and Latvia, with an additional global raw-material and goods-origin layer visible through Norway, China and Saudi Arabia. Estonia’s map is anchored by Finland, Latvia, Sweden and Germany. Latvia sits between these two trade systems.
In the data of its neighbours, Latvia appears not as a peripheral economy, but as a central Baltic exchange node. It is the largest destination for Lithuania’s total exports, the second-largest destination for Estonia’s exports, and one of the top three import sources for both neighbouring countries.
This does not erase Latvia’s domestic weaknesses. Its slower investment cycle, weaker growth indicators and import-heavy trade structure remain real problems. But the regional goods-trade map changes the analytical frame. Latvia is not only a country lagging behind its neighbours in selected macroeconomic indicators. It is also deeply embedded in the trade flows of both Lithuania and Estonia.
That means a slowdown in Latvian demand, investment, construction, transport activity or consumption does not remain only a Latvian domestic issue. It can quickly become an export problem for Lithuania and Estonia.
The key regional signal is clear: Baltic goods trade in early 2026 is active, but not broadly strong. It is shaped by energy flows, re-exports, selected industrial categories and dense neighbour-to-neighbour trade. In this map, Latvia is not the periphery. It is one of the central nodes through which the Baltic goods economy is connected.