Baltic Industry in Q3 2026: Factory Growth, Shifting Rankings
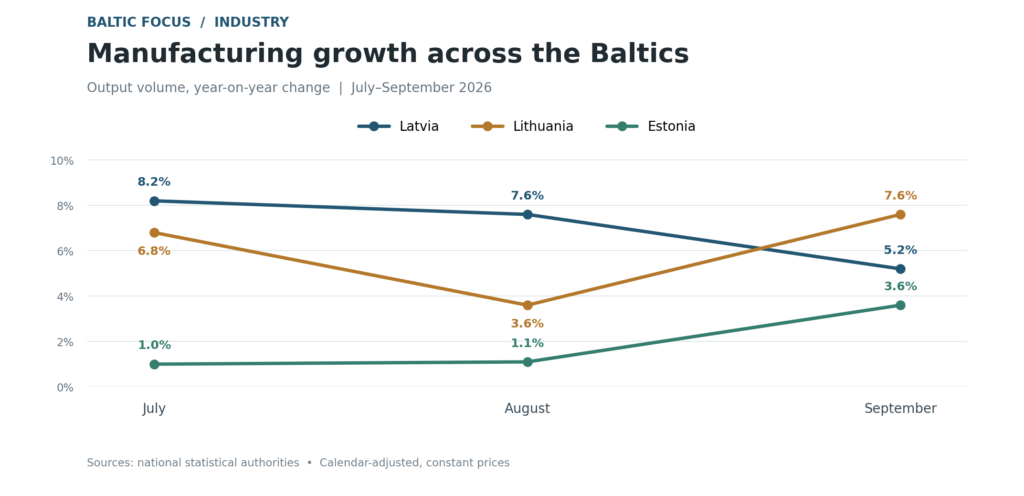
Manufacturing output grew year on year in Latvia, Lithuania and Estonia in every month of the third quarter of 2026. Yet the nine monthly readings reveal different trajectories rather than a single regional trend. Latvia began the quarter with the fastest manufacturing growth, Estonia accelerated from a much lower rate, and Lithuania’s annual growth rate dipped in August before rebounding. The rankings shifted when the comparison widened from manufacturing to industry as a whole.
Baltic Focus has compiled this July–September comparison from monthly releases issued by the three national statistical authorities. Taken together, the three months show how differently manufacturing and energy-related production developed across the region.
Three paths through the quarter
Latvia’s manufacturing output grew by 8.2% year on year in July, 7.6% in August and 5.2% in September. The rate of annual growth eased, although it remained positive throughout. Latvia’s statistics office reported 7.0% manufacturing growth for Q3 as a whole compared with the corresponding quarter of 2025, and a 1.8% increase from Q2 on a seasonally adjusted basis.
Lithuania followed a less even path: manufacturing grew by 6.8% in July, 3.6% in August and 7.6% in September. Seasonally adjusted output fell month on month in July and August before rising by 2.1% in September. Estonia’s annual manufacturing growth rose from 1.0% in July and 1.1% in August to 3.6% in September. Its seasonally adjusted manufacturing output increased from month to month in all three months.
These are changes from the corresponding months of 2025, not a calculation of each country’s growth over the quarter. The chart traces how those annual growth rates changed during Q3.
Factory output and total industry tell different stories
Output volume, annual change
| Country / measure | July | August | September |
|---|---|---|---|
| Latvia · manufacturing | +8.2% | +7.6% | +5.2% |
| Latvia · all industry | −0.2% | +0.3% | +2.6% |
| Lithuania · manufacturing | +6.8% | +3.6% | +7.6% |
| Lithuania · all industry | +6.4% | +3.2% | +7.0% |
| Estonia · manufacturing | +1.0% | +1.1% | +3.6% |
| Estonia · all industry | +2.3% | +4.5% | +6.0% |
Latvia led manufacturing growth in July and August but ranked last in total industrial production growth in all three months. Estonia had the weakest manufacturing growth throughout the quarter, yet led the broader industrial comparison in August. Lithuania led total industrial growth in July and September and manufacturing growth in September. These differences are not visible from a single headline index.
The contrasting energy figures help explain these differences, although the sector’s precise contribution cannot be calculated by subtracting manufacturing growth from the total industrial growth rate. Latvia’s electricity and gas supply output fell by 35.6%, 44.6% and 18.9% year on year in July, August and September. Electricity and gas supply output fell by 32.9% over Q3 as a whole. Total industrial production rose by just 1.0% year on year, against 7.0% growth in manufacturing.
Estonia’s energy-sector output moved in the opposite direction: +16.0% in July, +56.9% in August and +51.4% in September. Statistics Estonia attributed the large late-quarter increases partly to stronger electricity exports and the unusually low production base in the corresponding months of 2025. Lithuania reported declines of 2.3%, 5.1% and 7.0% in its electricity, gas, steam and air-conditioning supply sector.
The three energy categories are not identical: Latvia excludes heat supply and air conditioning, while Lithuania includes them. Lithuania’s total-industry indicator also includes water supply. These differences limit direct comparison of the wider industrial indices.
The factories behind the averages
Across the quarter, food manufacturing and wood processing followed contrasting paths in Latvia and Estonia. Latvian food manufacturing maintained positive annual growth of 11.7%, 8.9% and 7.4%, while Estonian food output moved from a 1.5% increase in July to declines of 3.8% in August and 7.0% in September. Statistics Estonia identified lower dairy output as an important factor.
Latvia’s largest manufacturing branch, wood processing, contracted in July (−3.8%) and September (−1.9%), with only a marginal increase in August (+0.1%). Estonia’s wood industry expanded by 10.8% in July, contracted by 0.6% in August and grew by 3.4% in September. Machinery and equipment manufacturing recorded double-digit annual growth in both countries in each month, while annual growth in Latvia’s fabricated metal products eased sharply from 33.9% in July to 7.5% in September. That change in rate alone does not establish why output moved.
Lithuania’s petroleum refining sector altered the shape of its manufacturing headline. Excluding refined petroleum products, annual manufacturing growth was 7.4% in July, 5.7% in August and 6.1% in September. Manufacturing excluding refining grew faster than the overall manufacturing sector in July and August, but more slowly in September. The relative effect of refining therefore changed during the quarter; it would be misleading to treat refining as the consistent source of Lithuania’s manufacturing expansion.
Export sales: a separate measure
Manufacturing sales also rose in Latvia and Estonia. Unlike the output-volume indices, however, these figures are measured in current prices. In Latvia, total manufacturing turnover grew by 8.5%, 7.8% and 7.0% year on year from July through September; its export sales grew by 8.5%, 7.4% and 5.9%. Estonia recorded increases in export sales of 7.5%, 8.0% and 13.0% over the same months. Nominal sales growth should not be confused with growth in the physical volume of production.
What the quarter shows
The three-month perspective yields a more differentiated picture of Baltic industry than any single monthly release. Latvia combined sustained factory growth with a severe contraction in electricity and gas supply. Estonia’s factories moved back into positive annual growth while a surge in energy-sector output amplified its overall industrial figures. Lithuania’s manufacturing gains continued across the quarter, but petroleum refining did not play the same relative role in every month.
For businesses assessing the region, no country led every industrial measure throughout Q3. The answer depends on whether the question concerns manufacturing, energy or the broader industrial index — and on how performance developed across the quarter rather than in September alone.
Method: Baltic Focus compiled this comparative review from official monthly primary data. The monthly annual changes refer to constant-price output volume adjusted for calendar effects; they are not quarterly growth rates. Latvia’s Q3 figures are taken from its official quarterly comparison. Published data may be revised.
Primary sources: Statistics Latvia — July, 4 September 2026; August, 6 October 2026; September, 4 November 2026. Lithuanian State Data Agency — releases of 27 August, 28 September and 27 October 2026. Statistics Estonia — July, 4 September, August, 5 October and September, 5 November 2026.