March sharpened the industrial contrast inside the Baltics. Latvia posted the strongest headline increase, Lithuania continued to expand, while Estonia moved deeper into negative territory. The region did not show a synchronized industrial recovery. It showed three different sector stories.
Latvia’s result was the most striking. Total industrial output rose by 9.5% year on year, supported by a large increase in electricity and gas supply and a positive manufacturing reading. Lithuania’s growth was smaller, but its manufacturing signal remained strong. Estonia, by contrast, contracted in both total industry and manufacturing, while energy production also fell sharply.
Regional data card
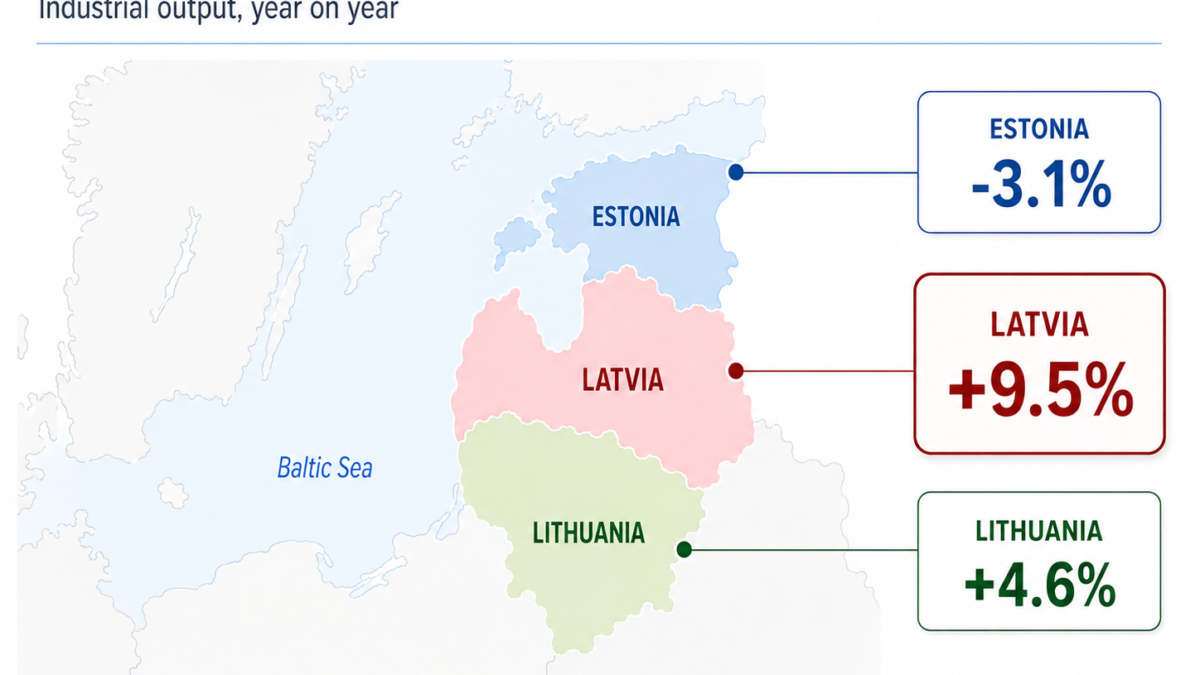
Latvia: industrial output +9.5% y/y; manufacturing +4.4% y/y; month on month +1.3%
Lithuania: industrial output +4.6% y/y; manufacturing +5.1% y/y; month on month +2.8%
Estonia: industrial output −3.1% y/y; manufacturing −1.2% y/y; month on month −2.5%
Latvia
Latvia reported the strongest March headline in the Baltics. Industrial production rose by 9.5% year on year, while manufacturing increased by 4.4%. Electricity and gas supply jumped by 34.6%, giving a major lift to the total industrial index. Mining and quarrying remained weak, falling by 21.5%.
The energy result is important, but it is not simply a price story. Latvia’s industrial production index measures output volume in comparable prices. This means the rise in electricity and gas supply reflects stronger real output, not just higher market prices. That matters because the Baltic electricity market was already moving into a lower-price phase after earlier volatility.
Inside manufacturing, the picture improved compared with February. Output increased in Latvia’s three largest manufacturing branches: food production rose by 8.7%, wood and wood products by 0.5%, and fabricated metal products by 31.8%. Growth was also recorded in rubber and plastic products, furniture, chemicals, non-metallic mineral products and machinery.
The weak spots did not disappear. Repair and installation of machinery and equipment fell by 38.6%, beverage production by 32.5%, and textiles by 10.1%. Latvia’s March number is therefore strong, but not evenly strong across the industrial base.
Latvia data card
Industrial output: +9.5% y/y
Manufacturing: +4.4% y/y
Electricity and gas supply: +34.6% y/y
Mining and quarrying: −21.5% y/y
Month on month: +1.3%
Manufacturing month on month: +1.8%
Manufacturing turnover: +3.2% y/y
Domestic turnover: +4.1% y/y
Export turnover: +2.8% y/y
Lithuania
Lithuania also reported growth in March, though without Latvia’s dramatic headline. Total industrial production rose by 4.6% year on year, while manufacturing increased by 5.1%. Excluding refined petroleum products, manufacturing growth was even stronger, at 7.9%.
This makes Lithuania’s March result less spectacular than Latvia’s, but still structurally important. Lithuania again showed clear manufacturing traction, and its industrial expansion was not dependent on one headline utility surge. On a monthly basis, total industrial production rose by 2.8% after seasonal and working-day adjustment, while manufacturing increased by 4.2%.
Several branches supported the monthly increase, including non-metallic mineral products, chemicals and textiles. At the same time, the data remained uneven: pharmaceuticals, other manufacturing and refined petroleum products declined from February.
For the first quarter as a whole, Lithuania’s industrial production rose by 4.2% year on year, while manufacturing increased by 3.6%. This gives Lithuania the clearest continuing manufacturing signal in the region.
Lithuania data card
Industrial output: +4.6% y/y
Manufacturing: +5.1% y/y
Manufacturing excluding refined petroleum products: +7.9% y/y
Month on month: +2.8%
Manufacturing month on month: +4.2%
Q1 industrial output: +4.2% y/y
Q1 manufacturing: +3.6% y/y
Electricity, gas, steam and air conditioning: −0.7% y/y
Estonia
Estonia moved in the opposite direction. Industrial production fell by 3.1% year on year in March. Manufacturing declined by 1.2%, while energy production dropped by 19.5%. Mining was the only main industrial sector to grow, rising by 5.9%.
The manufacturing setback was strongly linked to food production, which fell by 4.1%. Statistics Estonia noted that food production has now declined for three consecutive months, following drops of 6.9% in January and 5.3% in February. The agency linked the weakness to falling retail volumes, weaker demand and rising prices.
The decline was not universal. More than half of manufacturing branches increased output. Among larger activities, wood processing rose by 5.0%, fabricated metal products by 3.5%, and computers, electronics and optical equipment by 12.6%. Electrical equipment also remained slightly positive, rising by 0.7%.
The external side was more stable than in February. In March, 68.6% of manufacturing output was sold abroad. Manufacturing sales at current prices were unchanged year on year, with domestic sales down 1.1% and export sales up 0.6%. But this was not enough to prevent a decline in real output.
Estonia data card
Industrial output: −3.1% y/y
Manufacturing: −1.2% y/y
Mining: +5.9% y/y
Energy: −19.5% y/y
Month on month: −2.5%
Manufacturing month on month: +0.7%
Manufacturing sales: 0.0% y/y
Domestic sales: −1.1% y/y
Export sales: +0.6% y/y
Share sold abroad: 68.6%
Conclusion
March did not confirm a single Baltic industrial recovery. It showed a sharper regional split.
Latvia delivered the strongest headline result, supported by a major rise in electricity and gas supply and a better manufacturing reading than in February. Lithuania continued to show the most consistent manufacturing traction, with output rising both annually and monthly. Estonia remained the weak point, with total industry, manufacturing and energy all in decline.
The March data are therefore better than a simple negative regional reading would suggest. But they are also not a clean synchronized rebound. The Baltic industrial map is still divided: Latvia rebounded sharply, Lithuania expanded steadily, and Estonia remained under pressure.