
Inflation in the Baltic states remained far below the crisis peaks of 2022-2023 in the first quarter of 2026, but the regional picture no longer moved in one simple pattern. Latvia started the quarter with the softest price pressure, Estonia showed the most uneven month-to-month path, and Lithuania ended Q1 with the strongest annual inflation in the region. By March, fuel had clearly re-entered the inflation story across all three markets, but the pass-through into headline prices differed sharply.
Data Card
- Latvia: annual inflation moved from 2.9% in January to 2.3% in February and 3.4% in March; monthly change was 0.0%, +0.2%, +1.9%.
- Estonia: annual inflation was 3.7% in January, 3.1% in February, 3.6% in March; monthly change was +1.0%, +0.8%, 0.0%.
- Lithuania: annual inflation stood at 3.1% in January, 3.6% in February, 4.8% in March; monthly change was +1.5%, +1.1%, +1.5%.
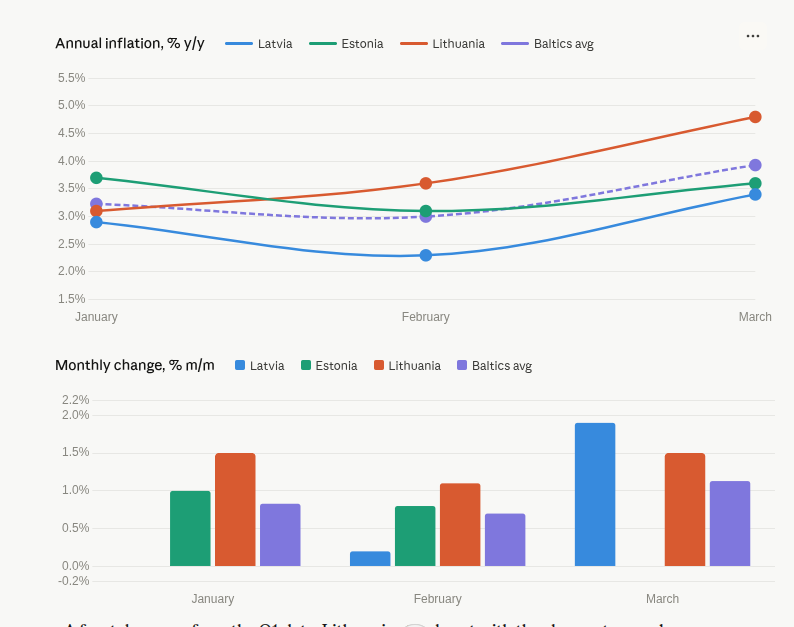
Q1 did not produce a single Baltic inflation pattern. Latvia moved from a relatively restrained start to a sharp March jump led by transport and fuel. Estonia’s quarter was more mixed, with electricity, food and services repeatedly offsetting one another. Lithuania showed the broadest and most persistent price pressure through the quarter and closed Q1 with the highest annual inflation reading among the three states.
Latvia
Latvia had the calmest start to the quarter in headline terms, but that softness did not last. January and February were still shaped mainly by housing, utilities and food, while March brought a much stronger transport-led move.
Data Card
- January: CPI +2.9% y/y, 0.0% m/m
- February: CPI +2.3% y/y, +0.2% m/m
- March: CPI +3.4% y/y, +1.9% m/m
In January, the main annual pressure came from food and housing, while transport prices were down year on year. In February, food prices fell 0.6% month to month on retail promotions, and transport prices were still 1.7% lower than a year earlier. In March, transport prices jumped 8.4% month on month, driven by fuel, while clothing and footwear rose 5.7% and housing costs fell 1.1% as electricity prices dropped.
Latvia’s Q1 pattern was a move from relatively contained inflation to a sharp March rebound. The first two months were still supported by softer food pricing and weaker transport costs, but by the end of the quarter fuel and seasonal goods had clearly taken over the inflation story.
Lithuania
Lithuania showed the broadest quarter-long inflation pressure in the Baltics. Price growth was already strong at the beginning of the year, and March added a new transport and fuel impulse on top of existing pressure in housing and services.
Data Card
- January: CPI +3.1% y/y, +1.5% m/m
- February: CPI +3.6% y/y, +1.1% m/m
- March: CPI +4.8% y/y, +1.5% m/m
In January, the monthly rise was driven mainly by heating-related costs, electricity, alcohol and vehicle maintenance. In February, price growth was again supported by housing costs, fuel, cigarettes and holiday travel. In March, transport prices rose 7.3% month on month, driven by diesel and petrol, while housing, water, electricity, gas and other fuels rose 1.8% and clothing and footwear 5.4%. Food prices, however, fell 0.5% over the month.
Lithuania entered March with inflation already running on a wider base than in its Baltic neighbours. Utilities, services and excise-related items were already exerting pressure earlier in the quarter, and the March fuel shock pushed the country to the strongest quarter-end reading in the region.
Estonia
Estonia had the most uneven inflation path in Q1. The quarter was shaped by sharp swings in electricity, food and services, which repeatedly altered the effect of broader price pressures on the monthly headline index.
Data Card
- January: CPI +3.7% y/y, +1.0% m/m
- February: CPI +3.1% y/y, +0.8% m/m
- March: CPI +3.6% y/y, 0.0% m/m
In January, the monthly rise was driven mainly by electricity, food and alcoholic beverages. In February, the main annual pressure came from food, healthcare, tobacco and housing, while holiday trips, heating and fuel pushed the monthly index higher. In March, fuel prices surged again, but the overall CPI stayed flat because electricity fell 14.1% and food prices fell 0.6% from February.
In Estonia, the March fuel shock was offset not only by lower food prices, but also by a sharp fall in electricity prices, driven by warmer weather, lower power demand, stronger solar and hydro generation, and cheaper imports from Finland
Estonia’s inflation path in Q1 was the least linear. Strong pressure from services and food was repeatedly offset by electricity-driven volatility, which is why even a sharp March fuel shock did not produce a monthly increase in the headline CPI.
March snapshot
By March, all three Baltic states were once again facing a fuel-led inflation impulse, but the outcomes diverged. Latvia recorded the sharpest monthly jump at +1.9%, Lithuania followed at +1.5%, and Estonia remained flat at 0.0% because cheaper electricity and food offset higher fuel prices. In annual terms, March closed at 3.4% in Latvia, 4.8% in Lithuania and 3.6% in Estonia.
The first quarter of 2026 suggests that Baltic inflation is stabilising in headline terms but fragmenting in structure. The region is no longer dominated by one post-energy-shock story. Instead, Latvia, Lithuania and Estonia are increasingly reacting to the same external triggers through different domestic price channels. By March, fuel had become the common regional driver again, but the inflation mechanics were already clearly diverging.
Data basis: National CPI releases, January-March 2026.
Comparison method: National CPI/VKI, not HICP.
Interpretation: Final comparative conclusion based on month-by-month official releases.