Data card: April 2026 foreign trade data, published on 9 June 2026
| Estonia | Latvia | Lithuania | |
|---|---|---|---|
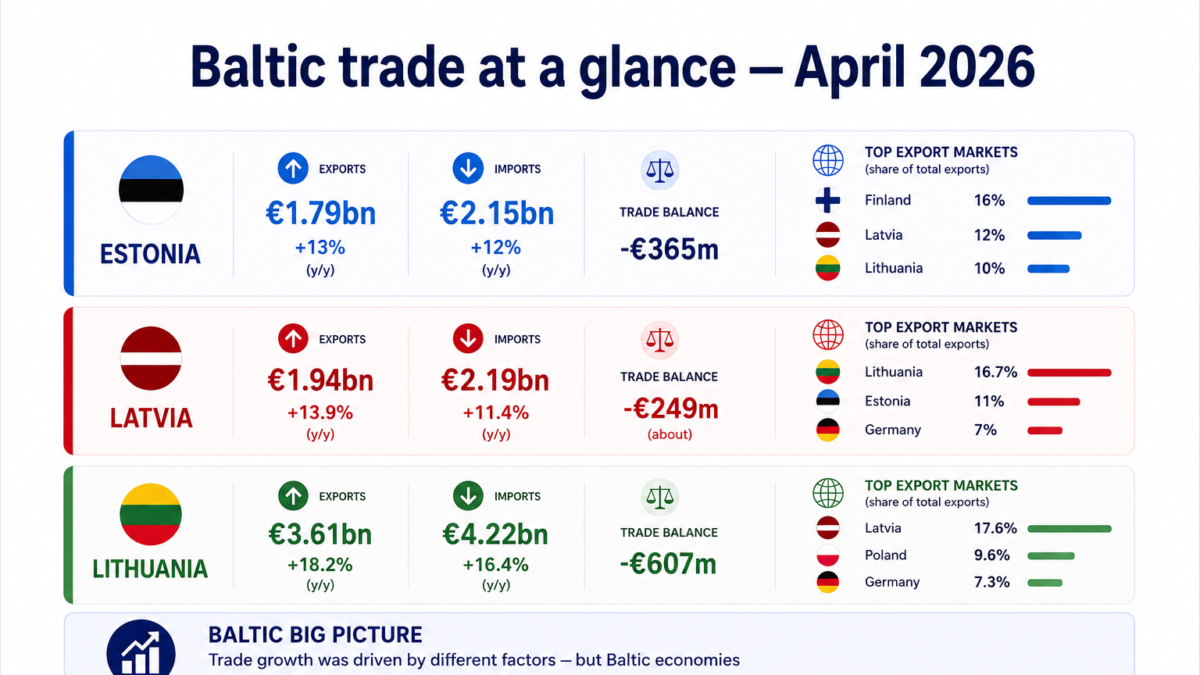
| Export growth, year on year | +13% | +13.9% | +18.2% |
| Export value | €1.79bn | €1.94bn | €3.61bn |
| Import growth, year on year | +12% | +11.4% | +16.4% |
| Import value | €2.15bn | €2.19bn | €4.22bn |
| Trade balance | -€365m | about -€249m | -€607m |
| Visible driver | Fuels and re-export | Mineral fuels | Mineral fuels, machinery and electrical equipment |
| Baltic signal | Latvia and Lithuania are key export markets | Lithuania and Estonia dominate regional trade links | Latvia is the largest export market |
April brought a visible acceleration in goods trade across all three Baltic states. Estonia, Latvia and Lithuania all reported double-digit year-on-year growth in both exports and imports.
At first glance, this looks like an energy story. Mineral fuels, oil products, gas and related flows were among the strongest contributors in all three countries. That reading is correct — but incomplete.
The more interesting question is whether the Baltic economies are becoming harder to read as three separate national markets. April does not prove that the Baltics are already one domestic market. But the data show why the question is becoming more relevant.
Estonia: export growth with a strong re-export component
Estonia’s goods exports rose by 13% year on year in April, reaching €1.79bn. Imports increased by 12% to €2.15bn. The trade deficit was €365m.
The strongest driver was re-export. Statistics Estonia said total export growth was influenced most by a 19% increase in re-exports, especially previously imported fuels. Mineral products, transport equipment and electrical equipment were among the key categories.
The regional link is visible in the partner structure. Finland remained Estonia’s largest export partner, but Latvia and Lithuania followed. Latvia accounted for 12% of Estonia’s exports in April, while Lithuania accounted for 10%.
Estonia’s April data are therefore not a clean industrial-export story. They are partly about fuel flows and re-export. But they also show that Latvia and Lithuania are not marginal markets for Estonia. They are core destinations.
Latvia: the Baltic trade map is already visible
Latvia’s exports rose by 13.9% year on year in April to €1.94bn. Imports increased by 11.4% to €2.19bn. The trade deficit was about €249m.
Mineral fuels were again the strongest visible driver. Exports of mineral fuels, oil and related products rose sharply, with motor gasoline contributing strongly to the increase. Imports of mineral fuels also grew, driven by natural gas and diesel.
But Latvia’s partner structure is the more important signal. Lithuania was Latvia’s largest export partner in April, taking 16.7% of total exports. Lithuania was also Latvia’s largest import partner, accounting for 21.8% of imports. Estonia was Latvia’s second-largest export partner and fourth-largest import partner.
Latvia therefore looks less like a small standalone national market and more like a hub in intra-Baltic trade.
Lithuania: not just fuel, but several industrial cycles
Lithuania recorded the strongest headline growth among the three Baltic states. Goods exports rose by 18.2% year on year in April to €3.61bn, while imports increased by 16.4% to €4.22bn. Exports of Lithuanian-origin goods rose by 19.6%.
The first driver is obvious: mineral fuels. Exports of mineral fuels, oils and related products rose by 88.7% year on year in April.
But this should not be read only as a price or base effect. Lithuania is the only Baltic state with a major oil refinery. ORLEN Lietuva’s Mažeikiai refinery entered 2026 after a stronger operating year. In a 30 April 2026 press release, the company said the refinery processed 9.4 million tonnes of feedstock in 2025, used 90.6% of its actual capacity and increased production volumes by just over 5.5%. It also reported a 10% increase in inland-market sales, with more products sold in the Baltic region, Poland, Ukraine and other markets.
This links Lithuania’s April fuel-export surge to a wider refinery cycle: major investment, more stable operations and stronger regional sales.
A second layer is fertilizers. In January–April, exports of Lithuanian-origin fertilizers increased by 14.3%. This does not prove that Lifosa alone drove the increase. But the company matters because its recent history was not a normal business cycle: EuroChem’s 2024 annual review described Lifosa as a restarted plant and reported 0.4 MMT of production in 2024, while Lifosa’s own materials describe the business as strongly export-oriented.
By February 2025, fertilizer-market reporting again listed Lifosa among suppliers adjusting DAP prices for German shipments, including Lithuanian DAP offered through German seaports. That is not proof of full recovery, but it is a clear market signal: Lithuanian phosphate products were again visible in European fertilizer flows.
A third layer is technology and industrial equipment. Machinery and mechanical equipment exports rose by 38.3% year on year in April. Imports of electrical machinery and equipment rose by 46.5%. Over January–April, machinery, mechanical appliances and electrical equipment accounted for 13.9% of Lithuania’s total exports and 10.3% of Lithuanian-origin exports.
This category is broad. It should not be automatically reduced to lasers, photonics or advanced technology. But it does overlap with Lithuania’s real technology-manufacturing base, including machinery, electronics, components and specialised industrial niches.
Lithuania’s April rebound is therefore the most interesting of the three. It combines fuel, refinery operations, fertilizer-market normalisation and a machinery/electrical equipment layer. That makes it more than a simple energy-price story.
What the three releases show together
All three Baltic states reported stronger goods trade in April, and mineral products were a major part of the increase in each case. That limits the conclusion: this was not a clean, broad-based export boom.
But the partner structure matters. Latvia and Lithuania are central to Estonia’s export map. Lithuania dominates Latvia’s trade structure. Latvia is Lithuania’s largest export destination in the January–April period.
The Baltics are not growing in exactly the same way. Estonia’s April data are more exposed to re-export and fuel flows. Latvia looks like a hub in intra-Baltic trade. Lithuania adds the strongest industrial-recovery layer, with refinery operations, fertilizers, machinery and electrical equipment all worth tracking.
That is why the April data are useful: not because they prove that the Baltics are already one market, but because they show why the question is becoming harder to avoid.
At what point should the Baltics be analysed as a connected six-million-person market?
Sources: Statistics Estonia, Central Statistical Bureau of Latvia, State Data Agency of Lithuania, AB ORLEN Lietuva, EuroChem, Lifosa, ChemAnalyst.