Diesel prices punched through the ceiling in March: Lithuania +42%, Latvia +35%
April inflation flashes show a common Baltic fuel signal: Lithuania reported diesel prices 42.4% higher year-on-year, Latvia 34.9% higher, while Estonia said diesel and petrol were the main drivers of its April price rise.
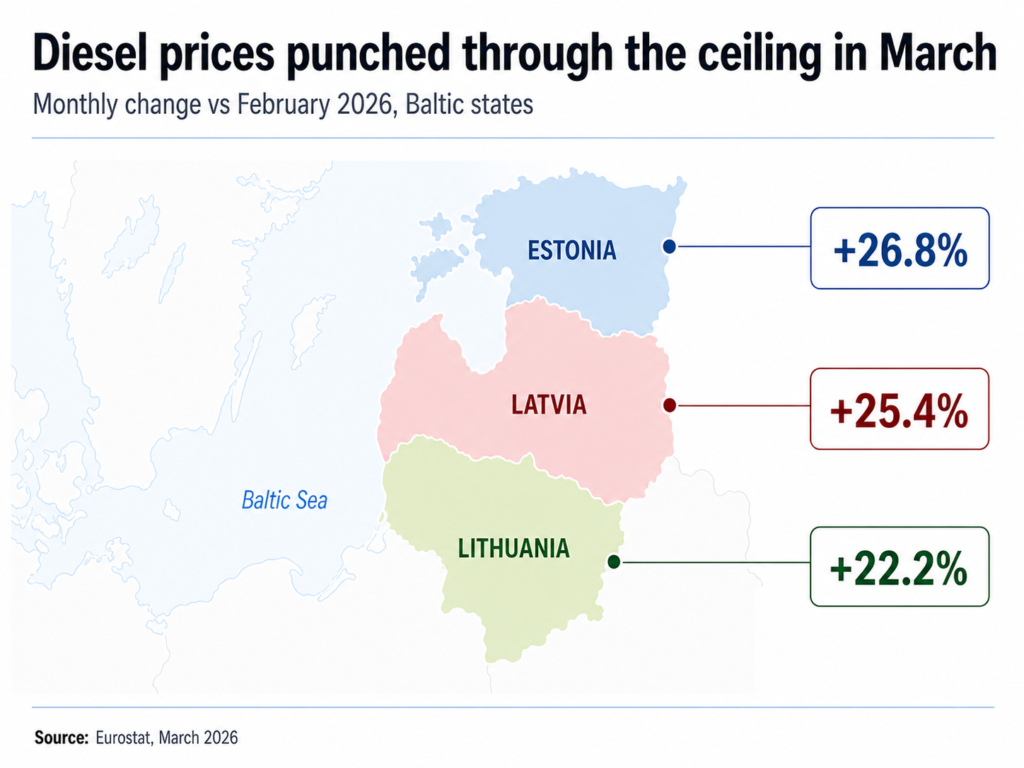
April inflation flashes show a common Baltic fuel signal: Lithuania reported diesel prices 42.4% higher year-on-year, Latvia 34.9% higher, while Estonia said diesel and petrol were the main drivers of its April price rise.
April’s first inflation data from the Baltics point to the same pressure point: fuel.
In Estonia, the harmonised index of consumer prices rose by 0.9% month-on-month and 3.3% year-on-year in April, according to Statistics Estonia’s flash estimate. The agency said the rise was mainly driven by high diesel and petrol prices.
Lithuania’s flash HICP estimate showed a stronger annual inflation signal: 4.9% year-on-year and 0.7% month-on-month. The detailed Lithuanian breakdown shows why fuel matters: diesel prices were 42.4% higher than a year earlier, petrol prices rose by 21.1%, and other personal transport fuels also added to the headline figure.
Latvia has not yet published its Q1 GDP flash estimate, but it has published a detailed April fuel price release. According to Latvia’s Central Statistical Bureau, average fuel prices rose by 8.7% month-on-month in April. Diesel prices increased by 8.7%, petrol by 8.2%, and auto gas by 11.6%.
Year-on-year, Latvia’s average fuel price level was 28.1% higher in April. Diesel was 34.9% more expensive than in April 2025, petrol 14.8% higher, and auto gas 16.2% higher.
Data card: Baltic April 2026 inflation and fuel signal
| Country | April 2026 early price signal | Monthly change | Annual change | Fuel role |
|---|---|---|---|---|
| Estonia | HICP flash estimate | +0.9% m/m | +3.3% y/y | Diesel and petrol named as main drivers |
| Lithuania | HICP flash estimate | +0.7% m/m | +4.9% y/y | Diesel +42.4% y/y, petrol +21.1% y/y |
| Latvia | Detailed fuel price data | Fuel +8.7% m/m | Fuel +28.1% y/y | Diesel +34.9% y/y, petrol +14.8% y/y |
Lithuania: fuel explains a large part of the inflation headline
Lithuania’s release is especially useful because it gives both price changes and contributions to annual HICP inflation.
The biggest positive contributor was diesel. Diesel prices rose by 42.4% year-on-year, adding 0.724 percentage points to annual inflation. Petrol prices rose by 21.1%, adding another 0.673 percentage points.
Other personal transport fuels added 0.167 percentage points, while liquefied petroleum gas added 0.063 percentage points.
Together, these fuel-related positions contributed around 1.63 percentage points to Lithuania’s 4.9% annual HICP flash estimate.
In other words, fuel alone explains roughly one third of Lithuania’s April annual inflation figure.
Data card: Lithuania fuel contribution to April HICP flash
| Lithuania, April 2026 HICP flash | Price change y/y | Contribution |
|---|---|---|
| Diesel | +42.4% | +0.724 pp |
| Petrol | +21.1% | +0.673 pp |
| Other personal transport fuels | +17.8% | +0.167 pp |
| LPG | +19.7% | +0.063 pp |
| Total fuel-related contribution | ~1.63 pp |
Latvia: detailed fuel data show the April jump directly
Latvia’s April fuel data show the same pressure from a different angle. While Estonia and Lithuania published HICP flash estimates, Latvia’s Central Statistical Bureau published a detailed fuel price breakdown.
The monthly increase was broad-based:
| Latvia fuel prices, April 2026 vs March 2026 | Change |
|---|---|
| Average fuel price level | +8.7% |
| Diesel | +8.7% |
| Petrol | +8.2% |
| Auto gas | +11.6% |
The annual comparison is sharper:
| Latvia fuel prices, April 2026 vs April 2025 | Change |
|---|---|
| Average fuel price level | +28.1% |
| Diesel | +34.9% |
| Petrol | +14.8% |
| Auto gas | +16.2% |
The retail price table confirms the same pattern. Diesel rose from €15.20 per 10 litres in April 2025 to €20.51 in April 2026. Petrol 95 increased from €15.72 to €18.05, while auto gas rose from €9.20 to €10.70.
Data card: Latvia average retail fuel prices
| Fuel type | April 2025, EUR per 10 litres | April 2026, EUR per 10 litres | Change |
|---|---|---|---|
| Diesel | 15.20 | 20.51 | +34.9% |
| Petrol 95 | 15.72 | 18.05 | +14.8% |
| Petrol 98 | 16.29 | 18.80 | +15.4% |
| Auto gas | 9.20 | 10.70 | +16.3% |
Estonia: a milder headline, but the same driver
Estonia’s headline inflation signal looks milder than Lithuania’s. Its April HICP flash estimate was 3.3% year-on-year, compared with Lithuania’s 4.9%.
But the direction is similar. Statistics Estonia explicitly linked the April rise mainly to high diesel and petrol prices.
That makes Estonia important for the regional comparison. It shows that the fuel impulse is not only visible in Latvia’s detailed fuel table or Lithuania’s item-level HICP breakdown. It also appears in Estonia’s official explanation of the April inflation flash.
Why this matters
The April fuel jump matters because it arrives just as the Baltic economies are trying to define their 2026 recovery path.
Estonia’s Q1 GDP flash estimate showed a clearer recovery signal, with GDP up 1.3% year-on-year and 0.6% quarter-on-quarter after seasonal and working-day adjustment.
Lithuania’s Q1 GDP picture was more mixed: annual growth remained positive, but the seasonally and working-day adjusted quarter-on-quarter figure was –0.4%.
Latvia’s Q1 GDP flash estimate is still the missing public data point.
But even before Latvia completes the Baltic GDP comparison, the April price data already show one thing clearly: the region is entering Q2 with renewed fuel-cost pressure.
For households, this is a direct transport cost. For businesses, it feeds into logistics, delivery, agriculture, construction and retail margins. For policymakers, it complicates the inflation picture just as growth remains uneven across the three economies.
Source note
Sources: Statistics Estonia, April 2026 HICP flash estimate; Latvia Central Statistical Bureau, April 2026 fuel price data; Lithuania State Data Agency, April 2026 HICP flash estimate.