June 2026: Baltic electricity market splits into Estonia and the Latvia–Lithuania price cluster
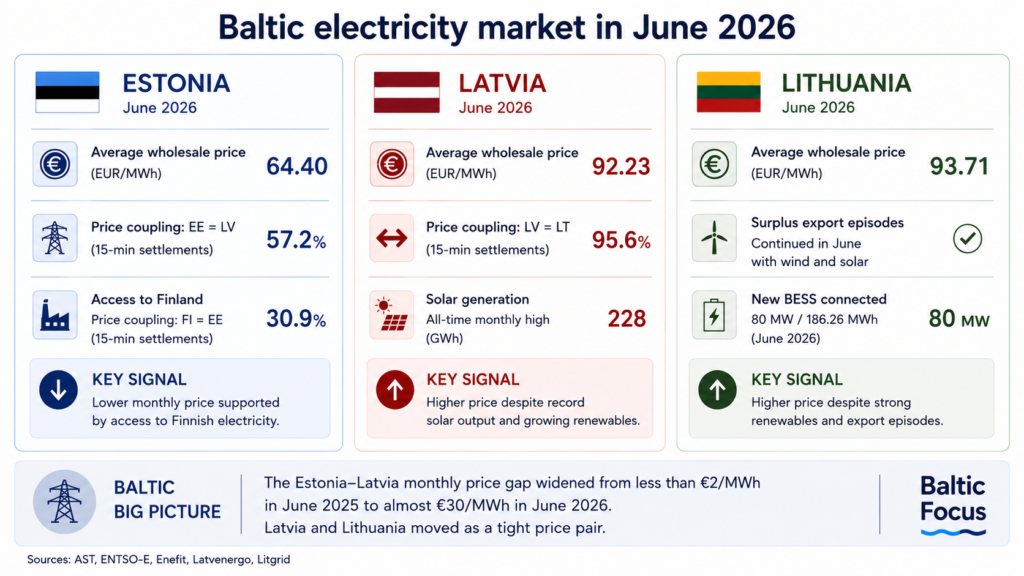
The Estonia–Latvia monthly price gap widened from less than €2/MWh to almost €30/MWh in one year, while Latvia and Lithuania moved as a tight price pair.
A material price divergence inside the Baltic electricity market became visible from October 2025 and reached its strongest level so far in June 2026.
In June 2026, Estonia recorded an average wholesale electricity price of €64.40/MWh. Latvia averaged €92.23/MWh, while Lithuania reached €93.71/MWh.
One year earlier, the Baltic monthly price picture had been almost flat. In June 2025, Estonia averaged €41.48/MWh, Latvia €43.06/MWh and Lithuania €43.07/MWh. The monthly gap between Estonia and Latvia was less than €2/MWh.
By June 2026, that gap had widened to almost €30/MWh.
The change matters not only because prices increased. It matters because the internal geography of Baltic wholesale prices changed.
AST monthly market reviews show that the divergence became materially visible from October 2025. During August and September, the Estonia–Latvia gap remained close to €3/MWh. In October, it widened beyond €15/MWh, stayed around that level in November, remained above €10/MWh in December and expanded further in June 2026.
The June question is therefore not whether a price gap existed.
It is why it became so much larger.
Baltic wholesale electricity prices
| June 2025 | June 2026 | |
|---|---|---|
| Estonia | €41.48/MWh | €64.40/MWh |
| Latvia | €43.06/MWh | €92.23/MWh |
| Lithuania | €43.07/MWh | €93.71/MWh |
BALTIC BIG PICTURE
The Estonia–Latvia monthly price gap widened from less than €2/MWh to almost €30/MWh in one year.
Source: AST.
June did not produce two symmetrical price zones
June data do not support a simple picture of Finland–Estonia versus Latvia–Lithuania.
AST’s 15-minute settlement data show a more asymmetric market.
Latvia and Lithuania shared identical prices during 95.6% of June’s 15-minute intervals. Estonia and Latvia matched during 57.2%. Finland and Estonia matched during only 30.9%.
The strongest price relationship therefore existed between Latvia and Lithuania, not between Estonia and Finland.
Estonia behaved differently. Rather than belonging to a fixed northern price zone, it acted as a northern hinge, influenced by both cheaper Finnish supply and conditions further south.
Price coupling in June 2026
LV = LT
95.6%
EE = LV
57.2%
FI = EE
30.9%
BALTIC BIG PICTURE
June showed one exceptionally tight Latvia–Lithuania pair and a more flexible Estonian price position.
Source: AST.
Renewable output rose, but so did prices in the Latvia–Lithuania cluster
June continued a paradox already visible in the Latvia–Lithuania price cluster: renewable electricity output kept rising, yet average wholesale prices also increased.
Latvia’s June solar output reached 228 GWh, described by Enefit as an all-time monthly high. The company estimated that Latvia produced almost 30% of all Baltic solar electricity during the month.
Lithuania showed a different form of renewable abundance. In April, renewable generation exceeded national electricity demand over a full week for the first time. In June, Lithuania continued to record periods when strong wind and solar production allowed surplus electricity to flow to neighbouring markets.
But the price result moved in the opposite direction. Latvia averaged €92.23/MWh and Lithuania €93.71/MWh, well above Estonia’s €64.40/MWh.
The issue was not the absence of renewable electricity. It was its market profile. Solar output was concentrated in daytime hours, while Baltic wind generation was 37% lower than June 2025 and non-solar generation in Latvia and Lithuania fell 25% from May.
That left the Latvia–Lithuania cluster more exposed in the hours when solar output fell and cheaper northern flows were constrained.
Renewables were only part of the picture
Latvia solar generation
228 GWh
all-time monthly high
Baltic wind generation
320 GWh
37% lower than June 2025
LV + LT non-solar generation
852 GWh
25% below May
BALTIC BIG PICTURE
Record solar output coincided with weaker wind generation and lower non-solar output across the Latvia–Lithuania price cluster.
Sources: Enefit, AST.
Different dependencies behind the same price split
The June divide was not simply a case of Estonia importing electricity while Latvia and Lithuania lacked generation.
Estonia’s lower monthly price was supported by access to Finnish electricity. Latvia and Lithuania had a different problem: local generation increased in important periods, especially through renewables, but its profile did not cover all high-price hours.
When solar output fell, wind was weak and non-solar generation was lower, the Latvia–Lithuania cluster still needed external supply. With north-to-south capacity limited or partly reserved, Latvia and Lithuania relied more on other import directions, including Poland and Sweden.
The split therefore reflected different dependencies: Estonia on access to Finland; Latvia and Lithuania on renewable timing, non-solar generation and constrained access to northern flows.
Balancing deserves closer attention
Maintenance on the Estonia–Latvia interconnection clearly influenced prices.
But June also points to another mechanism.
Throughout the month, Latvenergo repeatedly noted that part of cross-border transmission capacity was reserved for balancing services needed to maintain frequency stability. According to the company, this reduced the amount of cheaper electricity reaching Latvia and Lithuania in the day-ahead market.
The available data do not quantify how much of the monthly price gap can be attributed to this factor.
But the issue is important because the post-synchronisation Baltic system uses cross-border capacity for more than ordinary electricity trading. Part of that capacity may also be needed for balancing and system stability.
That makes the Estonia–Latvia border more than a temporary maintenance story.
New storage projects are entering the pipeline
The June price split also appeared while the Baltic flexibility pipeline continued to grow.
New storage projects are being connected and contracted in addition to already operating systems. In Lithuania, an 80 MW / 186.26 MWh battery energy storage system was connected in June. Sunly and Rolls-Royce also announced 490 MWh of planned battery storage across Latvia, together with a further 300 MWh project planned in Estonia.
These projects do not explain June’s price gap. They show that the market is already responding to the same problem: more renewable generation, more volatile price profiles and a greater need for flexibility.
What June shows
June 2026 does not prove that the Baltic electricity market has permanently divided into separate price regions.
It does show that the divergence visible since October 2025 has reached a new scale.
The June market can be described as:
- a very strong Latvia–Lithuania price relationship;
- Estonia acting as a more flexible northern hinge rather than part of a fixed Finland–Estonia zone;
- different dependencies behind the price split;
- and cross-border capacity increasingly shaped not only by trade, but also by balancing and frequency-stability needs.
The key question for autumn 2026 is whether this divide will harden. If the Estonia–Latvia gap persists beyond temporary maintenance and weather-driven generation swings, two price clusters inside one Baltic electricity region may become a central market issue.