Baltic Inflation in Q2 2026: One Region, Three Inflation Architectures
Inflation accelerated across all three Baltic states during the first two months of Q2 2026.
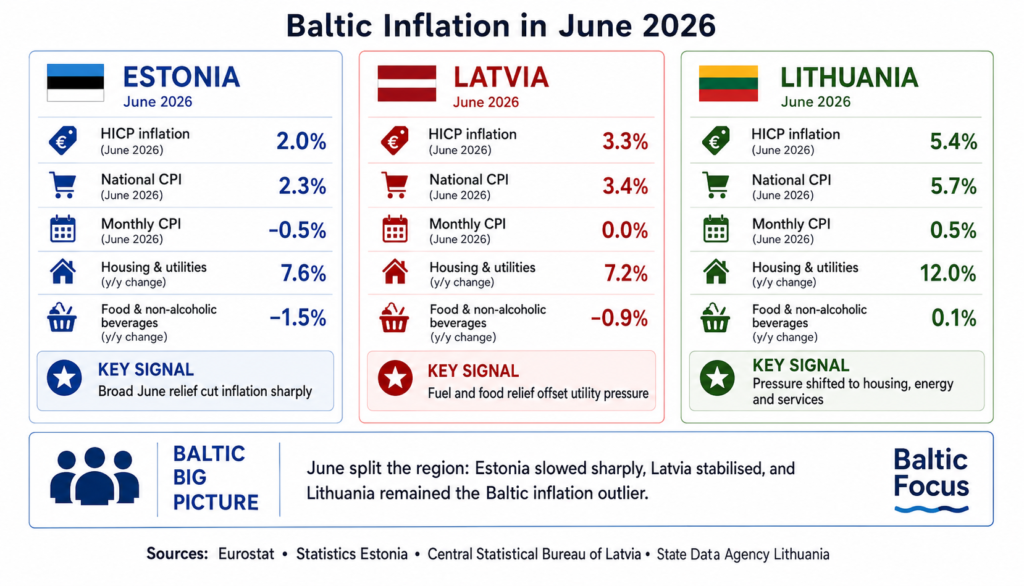
Inflation accelerated across all three Baltic states during the first two months of Q2 2026. Annual HICP rose from 3.2% to 3.6% in Estonia, from 2.9% to 3.5% in Latvia and from 4.9% to 5.1% in Lithuania between April and May. June then separated the region: Lithuania continued upward to 5.4%, Latvia eased slightly to 3.3%, while Estonia fell sharply to 2.0%.
The divergence is more important than a simple ranking of inflation rates. The three economies faced many of the same regional pressures, including energy and fuel volatility, but those pressures interacted with different national price structures, tax histories and demand conditions.
Methodology note
Baltic Focus uses the Harmonised Index of Consumer Prices (HICP) for cross-country comparison. National CPI data are used separately to examine monthly movements and country-specific price drivers. The two measures can therefore produce different headline rates for the same country and month.
Q2 trajectory: a common spring acceleration, then a June split
Annual HICP inflation, % YoY
| Country | April 2026 | May 2026 | June 2026 |
|---|---|---|---|
| Estonia | 3.2% | 3.6% | 2.0%* |
| Latvia | 2.9% | 3.5% | 3.3%* |
| Lithuania | 4.9% | 5.1% | 5.4%** |
* June flash estimate.
** Final June HICP; the earlier flash estimate was 5.5%.
The central question is why a common spring acceleration proved persistent in Lithuania, broadly stabilised in Latvia and reversed sharply in Estonia by June.
Estonia: June relief, fading tax effects
Estonia — June 2026
| Indicator | Change |
| National CPI | −0.5% MoM / +2.3% YoY |
| Food & non-alcoholic beverages | −1.2% MoM |
| Petrol | −5.5% MoM |
| Diesel | −8.6% MoM |
| Electricity | +18.7% YoY |
| Natural gas | +30.8% YoY |
Source: Statistics Estonia.
Lauri Matsulevits, an economist at Eesti Pank, attributes the slowdown to cheaper fuel and food, a high June 2025 comparison base and the fading annual impact of last year’s VAT pass-through. He nevertheless identifies energy carriers as the strongest upward influence on annual inflation.
Estonia’s Q2 architecture was therefore one of broad June relief reinforced by base effects and fading earlier tax effects, with energy still pushing upward.
Latvia: strong offsets, sticky utilities
Latvia — June 2026
| Indicator | Change |
| National CPI | 0.0% MoM / +3.4% YoY |
| Food & non-alcoholic beverages | −0.5% MoM |
| Fuel | −6.7% MoM |
| Housing & utilities | +7.2% YoY |
| Natural gas | +16.6% YoY |
| Restaurants & accommodation | +7.9% YoY |
Source: Central Statistical Bureau of Latvia.
Oļegs Krasnopjorovs, an economist at Latvijas Banka, links the June easing partly to lower fuel and food prices but warns that elevated European gas prices may feed into heating, electricity and agricultural costs with a lag, keeping inflation somewhat higher for longer.
From 1 July, a VAT cut from 21% to 12% on selected staple foods adds a new H2 disinflationary factor. Krasnopjorovs expects only partial pass-through to retail prices.
Latvia entered H2 with strong short-term offsets but persistent utility and service pressure.
Lithuania: the drivers changed, inflation kept accelerating
Lithuania is the clearest case of Q2 persistence. Annual HICP increased in every month of the quarter, from 4.9% in April to 5.1% in May and 5.4% in June.
Earlier in the quarter, transport and fuel-related costs were among the main upward influences. By June, the composition had shifted.
Lithuania — June 2026
| Indicator | Change |
| National CPI | +0.5% MoM / +5.7% YoY |
| Transport | −1.8% MoM |
| Housing & utilities | +3.0% MoM |
| Heat energy | +10.0% MoM |
| Electricity | +2.5% MoM |
| Services | +6.8% YoY |
Source: State Data Agency Lithuania.
By June, some of Lithuania’s earlier transport-related pressure had weakened, yet inflation continued to accelerate. The centre of pressure had shifted towards housing and energy, while service inflation remained elevated.
Lietuvos bankas places elevated energy prices at the centre of the 2026 inflation outlook, while tax effects, wage dynamics and second-pillar withdrawals shape the path ahead.
June CPI data fit that diagnosis: fuel relief was not enough to offset stronger housing and energy pressure, while service inflation remained high.
For H2, the bank also expects second-pillar withdrawals to support household consumption and forecasts average wage growth of 8.7% in 2026. These are prospective demand pressures rather than explanations for a specific share of Q2 inflation.
Lithuania therefore entered H2 with overlapping pressures: weaker transport costs, stronger housing and energy inflation, persistent service inflation and continued demand support.
Three national diagnoses, one Baltic picture
The national readings point in different directions.
In Estonia, Eesti Pank emphasises food and fuel relief, comparison effects and the fading annual impact of earlier tax changes.
In Latvia, Latvijas Banka focuses on the risk that gas costs may reach heating, electricity and agricultural prices with a lag, even after June’s short-term relief.
In Lithuania, Lietuvos bankas places energy at the centre of the 2026 inflation outlook while also pointing to taxes and domestic demand.
Placed side by side, the diagnoses show why similar regional pressures can produce different national outcomes.
What to watch in H2 2026
| Country | Key H2 question |
| Estonia | Does the June slowdown persist as base effects roll through while energy remains expensive? |
| Latvia | Does the VAT cut on selected foods pass through strongly enough to offset utility and gas-related pressure? |
| Lithuania | Do energy and service pressures remain persistent, and does additional household liquidity strengthen demand? |
For businesses and investors, the relevant question is therefore not only which Baltic country has the highest inflation rate today, but which national mechanisms are most likely to keep transmitting costs into prices during the second half of 2026.
Sources: Eurostat; Statistics Estonia; Eesti Pank; Central Statistical Bureau of Latvia; Latvijas Banka; State Data Agency Lithuania; Lietuvos bankas.