Mineral products drove over 40% of Latvia’s and Lithuania’s August export growth
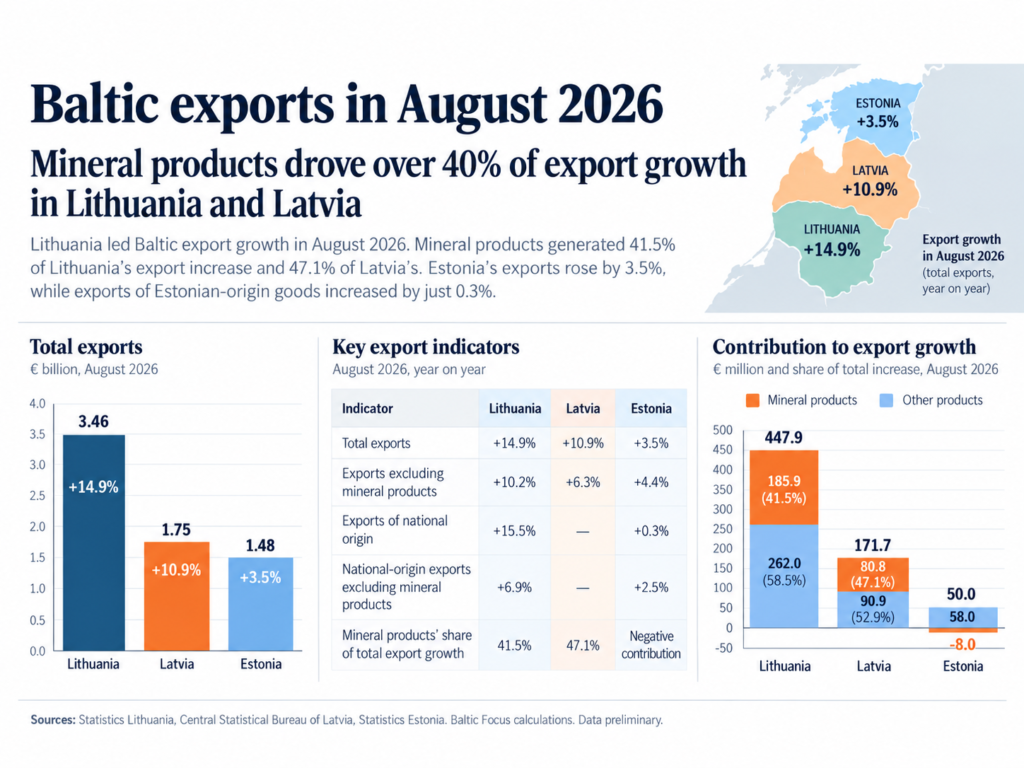
Lithuania led Baltic export growth in August 2026, but mineral products generated more than 40% of the increase in both Lithuania and Latvia. Estonia’s exports rose by 3.5%, while goods of Estonian origin increased by just 0.3%. Foreign-origin goods accounted for 94.3% of the country’s overall export gain.
Goods exports increased in all three Baltic countries in August 2026. Lithuania recorded annual growth of 14.9%, Latvia 10.9% and Estonia 3.5%, according to their national statistical offices.
Mineral products contributed €185.9 million to Lithuania’s export increase and €80.8 million to Latvia’s, accounting for 41.5% and 47.1% of their respective gains.
Excluding mineral products, exports increased by 10.2% in Lithuania, 6.3% in Latvia and 4.4% in Estonia.
| August 2026, year on year | Lithuania | Latvia | Estonia |
|---|---|---|---|
| Total exports | +14.9% | +10.9% | +3.5% |
| Exports excluding mineral products | +10.2% | +6.3% | +4.4% |
| Exports of national origin | +15.5% | — | +0.3% |
| National-origin exports excluding mineral products | +6.9% | — | +2.5% |
| Mineral products’ share of total export growth | 41.5% | 47.1% | Negative contribution |
All figures refer to export values at current prices. Mineral products cover CN chapters 25–27. Dashes indicate unavailable comparable figures, not zero growth. Estonian indicators are calculated from the detailed VKK10 dataset.
Lithuania: petroleum supports growth, but other sectors expand too
Lithuania exported €3.46 billion worth of goods in August, up €447.9 million from a year earlier.
Mineral-product exports increased from €457.5 million to €643.4 million, contributing €185.9 million to the overall gain. Mineral fuels and petroleum products accounted for almost the entire category.
Exports excluding mineral products grew by 10.2%.
Exports of Lithuanian-origin goods reached €2.47 billion, an increase of 15.5%. Excluding mineral products, Lithuanian-origin exports grew by a more moderate 6.9%.
Petroleum products processed in Lithuania can qualify as goods of Lithuanian origin even when the crude oil is imported. Their export value therefore cannot be treated as domestically generated value added without examining the associated cost of imported feedstock.
Lithuania’s largest export destination in August was Latvia, which received €465.2 million worth of goods, or 13.4% of the total. Poland followed with €348.6 million, Germany with €299.5 million, Estonia with €231.0 million and Ukraine with €199.1 million.
Of the €465.2 million exported to Latvia, €263.0 million, or 56.5%, consisted of goods of Lithuanian origin. For Lithuania’s exports to all destinations, the domestic-origin share was 71.3%.
Most mineral-fuel exports to Latvia were of Lithuanian origin: 94% of shipments worth €138.7 million. Cereals showed a similarly high share, at 89%.
Electrical equipment followed a different pattern. Lithuanian-origin goods accounted for just 4.5% of €37.7 million in exports to Latvia, while less than 1% of pharmaceutical exports were of Lithuanian origin.
Lithuania’s merchandise trade deficit narrowed to €223 million from €274 million a year earlier.
Latvia: almost half the increase comes from mineral products
Latvia exported €1.75 billion worth of goods in August, an annual increase of €171.7 million.
Mineral products contributed €80.8 million to this growth, or 47.1% of the total increase, although they represented approximately 12% of August exports.
Within the category, exports of mineral fuels and oils rose by 66.2% to €200.1 million. The value of light petroleum oils and related products exported increased by €41.6 million, accounting for part of the mineral-fuel gain.
Growth was not confined to fuel. Exports of machinery and electrical equipment increased by a combined €35.9 million, metals and metal products by €27.1 million, and chemical-industry products by €13 million.
Wood and wood products remained Latvia’s largest individual export group at €239.6 million, but recorded annual growth of only 0.7%.
Removing mineral products from the calculation leaves export growth of 6.3%. This figure includes goods of foreign origin and therefore cannot be compared directly with Lithuania’s 6.9% increase in domestically originating non-mineral exports.
Lithuania was Latvia’s largest export market, receiving €325.2 million worth of goods, or 18.6% of the total. Estonia accounted for 10.9%, Germany for 6.6% and Russia for 5.6%.
Latvia’s main shipments to Lithuania included electrical equipment worth €46.5 million, vehicles and parts worth €40.8 million, dairy products, eggs and honey worth €23.3 million, mineral fuels worth €22.2 million and wood products worth €20.6 million.
The Latvian statistics do not provide an equivalent monthly breakdown of how much of this bilateral export flow was of Latvian origin. The importance of foreign-origin goods in Latvia’s exports to Lithuania therefore cannot yet be measured on the same basis as Lithuania’s deliveries to Latvia.
Russia remained Latvia’s fourth-largest export destination in August. Exports increased by 7.1% to €98.8 million, with chemical-industry products contributing to the rise. Imports from Russia fell to €1.1 million.
Imports from all countries grew faster than exports, rising by 16.2% to €2.09 billion. Lithuania was the largest supplier, accounting for 22.8% of Latvian imports, followed by Germany, Poland and Estonia.
Latvia’s merchandise trade deficit reached €343 million.
Estonia: foreign-origin goods account for 94% of export growth
Estonia’s goods exports reached €1.48 billion in August, increasing by approximately €50 million from August 2025. Imports rose by 10% to €1.84 billion.
Exports of Estonian-origin goods increased by just 0.3%, or €2.79 million. Excluding mineral products, however, they grew by 2.5%, adding €20.95 million. This gain was almost entirely offset by an €18.16 million decline in mineral-product exports of Estonian origin.
Foreign-origin goods accounted for 94.3% of Estonia’s total export increase, with their value rising by 9.1% year on year.
Estonia’s mineral-product exports declined by €8 million, or 6%. Excluding that category, total exports increased by 4.4%.
Metal and metal-product exports grew by 18%, machinery by 7% and electrical equipment by 1%. Wood exports were unchanged, while agricultural and food exports declined by 5%.
Finland remained Estonia’s largest export market, receiving €246 million worth of goods. Latvia followed with €193 million, Lithuania with €142 million, Sweden with €132 million and Germany with €118 million.
Exports to Latvia increased by €31 million, including larger deliveries of natural gas and electricity. This increase in one destination coincided with a decline in Estonia’s mineral-product exports overall.
Lithuania was Estonia’s largest import supplier by value in August, accounting for €229 million, ahead of Finland at €217 million and Latvia at €209 million.
Imports from Lithuania increased by €50 million, largely because of higher purchases of mineral products, including motor fuels.
Estonia’s total imports of automotive fuel increased by 67% in value. Statistics Estonia attributed much of the increase to higher petroleum prices.
The country’s merchandise trade deficit widened from €249 million to €360 million.
Higher oil prices complicate the comparison
All three countries report trade values at current prices. Changes in export revenue therefore combine changes in prices, physical quantities and product composition.
According to the US Energy Information Administration, Brent crude averaged $91.08 per barrel in August 2026, compared with $67.87 in August 2025 — an increase of 34.2%.
Brent is a crude-oil benchmark, not a direct measure of the export prices received for diesel, gasoline or other refined products. These figures do not establish how much of the growth in Baltic petroleum exports came from higher prices rather than increased physical shipments.
They nevertheless show why nominal growth in fuel exports cannot be interpreted as an equivalent increase in production volumes.
Of Lithuania’s €465.2 million in exports to Latvia in August, more than €202 million consisted of goods of foreign origin. The share of Lithuanian-origin goods in this trade flow was almost 15 percentage points below the national export average.
Sources and methodology: State Data Agency of Lithuania, August 2026 international trade release and monthly CN2 exports dataset SD004717; Lithuanian-origin exports dataset SD004771; Central Statistical Bureau of Latvia, August 2026 foreign trade release and ATD020m database; Statistics Estonia, August 2026 foreign trade release and VKK10 dataset; US Energy Information Administration, Brent spot-price monthly series. Mineral-product contributions, export growth excluding mineral products and Estonian origin-based contributions are Baltic Focus calculations. Data are preliminary and subject to revision.