September 2026 confirms two distinct electricity price clusters in the Baltics
In October 2024, wholesale electricity prices were almost identical across the three Baltic states. Two years later, Estonia is trading at a substantial discount to Latvia and Lithuania, which continue to move almost in lockstep. September’s results confirm a price divide that has repeatedly returned over the past year, raising new questions about transmission capacity and the cost of electricity ahead of winter.
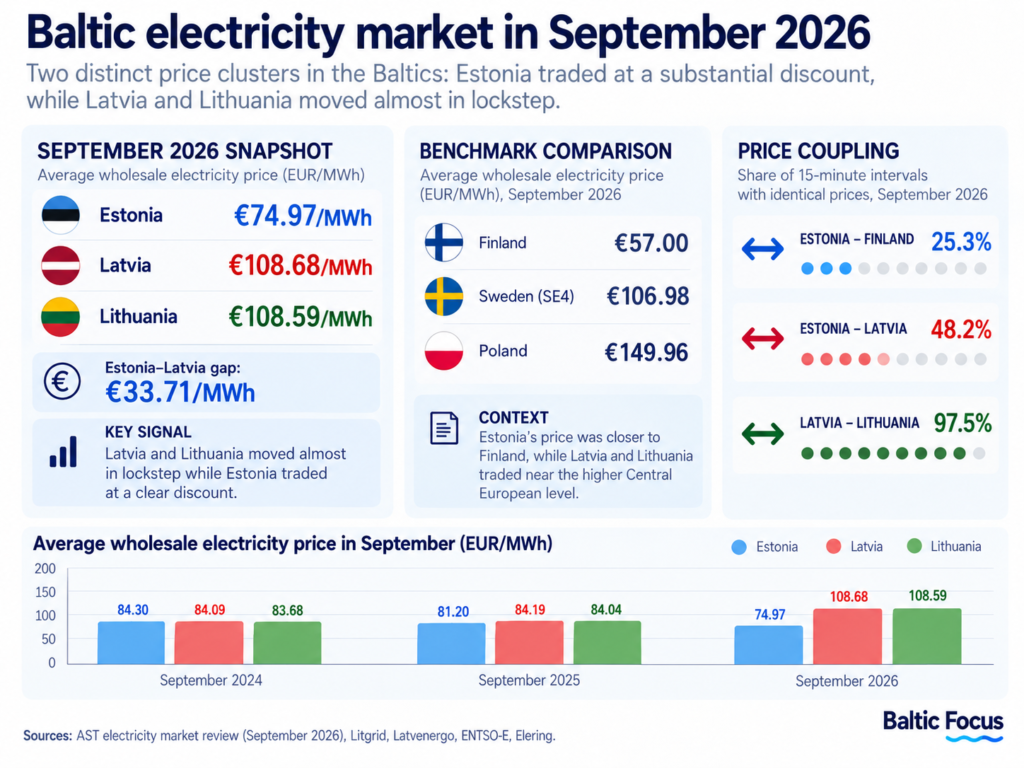
In October 2024, average electricity prices in Estonia, Latvia and Lithuania differed by just one cent per megawatt-hour. By October 2025, Estonia was already more than €15/MWh cheaper than its southern neighbours. In September 2026, that gap reached almost €34/MWh.
| Period | Estonia | Latvia | Lithuania |
|---|---|---|---|
| October 2024 | €91.37 | €91.38 | €91.38 |
| October 2025 | €89.67 | €105.06 | €105.06 |
| September 2026 | €74.97 | €108.68 | €108.59 |
Average wholesale electricity prices, €/MWh. Source: AST electricity market reviews.
The divergence has not been continuous. During the exceptionally cold January of 2026, prices across all three Baltic markets converged at around €153–154/MWh. But the gap reappeared in spring, persisted through summer and widened again in September.
The annual comparison is particularly revealing. Estonia’s September price was almost 8% lower than a year earlier, while Latvia and Lithuania paid approximately 29% more for wholesale electricity.
This is no longer simply a question of which Baltic country has the cheapest electricity in a particular month. The market has developed two recurring price clusters: a closely aligned Latvia–Lithuania pair and Estonia, whose prices increasingly reflect the conditions of the northern electricity market.
How one Baltic market developed two price clusters
The strongest evidence comes from the frequency with which neighbouring markets trade at identical prices.
In September, Latvia and Lithuania recorded the same wholesale price in 97.5% of all 15-minute trading intervals. Estonia and Latvia matched in only 48.2%, compared with 80.1% in September 2025.
The distinction matters because all three countries participate in the same European electricity market, but they retain separate bidding zones.
In each trading interval, the market-clearing price is determined by the marginal supply needed to meet demand, taking available cross-border transmission into account. When enough transmission capacity is available, neighbouring prices can converge. When that capacity is insufficient, the prices separate.
Estonia’s connection to Finland helps explain its position. Finland averaged just €57/MWh in September, compared with €75 in Estonia and nearly €109 in Latvia and Lithuania.
Yet cheaper Finnish electricity could not always move south in sufficient quantities to equalise Baltic prices. The Estonia-to-Latvia connection recorded average directional utilisation of 78.5% during September, with some days approaching full utilisation.
Estonia was not simply an extension of the Finnish price zone. Estonia and Finland had identical prices in only 25.3% of September’s trading intervals. Nevertheless, access to northern supply helped keep Estonia substantially cheaper than Latvia and Lithuania.
Transmission constraints are not a new explanation introduced after September’s price increase. In its November 2025 market review, AST had already identified maintenance-related restrictions in Estonia that limited the movement of cheaper Finnish electricity towards Latvia.
A year later, the price difference remains a recurring feature of the market, although the relative importance of network constraints, generation and demand varies over time.
Latvia and Lithuania faced a more expensive neighbourhood
September’s regional price map helps explain why the southern Baltic markets remained expensive.
Southern Sweden’s SE4 bidding zone averaged €106.98/MWh, almost exactly the price recorded in Latvia and Lithuania. Poland was considerably more expensive at €149.96/MWh.
The annual maintenance of NordBalt, the 700 MW electricity connection between Lithuania and Sweden, temporarily reduced available transmission capacity in September. The link returned to operation on 14 September, while total Baltic imports from Sweden fell by 21.8% from August to 180 GWh.
But even when NordBalt was available, southern Sweden was not a consistently cheap source of electricity. Its September average price was virtually identical to that of the southern Baltic markets.
The same regional relationships are visible in Lithuania’s electricity trade.
According to Litgrid’s preliminary September data, domestic power plants generated 939 GWh, covering 85% of the operator’s measure of national electricity demand, which includes storage charging and network losses. Lithuania nevertheless imported 353 GWh and exported 208 GWh during the month.
Almost half of those exports went to Poland, where electricity was substantially more expensive.
High domestic generation therefore did not make Lithuania independent of regional price formation. Electricity could enter from one direction and leave through another, depending on prices and available capacity in individual trading intervals.
For Latvia and Lithuania, the price of the marginal megawatt-hour was influenced not only by local generation but also by the cost of electricity available elsewhere in the interconnected market.
More renewables, but not necessarily lower monthly prices
Renewable generation continued to expand across the Baltics, although September also marked the seasonal transition away from summer solar production.
Baltic wind generation increased by 28% from August to approximately 655 GWh, while solar output fell by 41% to 439 GWh.
Lithuania’s wind farms generated 510 GWh, accounting for more than half of the country’s domestic electricity production. In Latvia, solar generation declined to approximately 140 GWh from 221 GWh in August, while hydropower recovered.
The growing contribution of wind and solar changes the timing of electricity supply as well as its total volume.
When renewable output is abundant, additional generation tends to lower market prices during those periods. But the effect on a monthly average depends on how often sufficient supply is available during higher-demand and higher-priced intervals.
Estonian energy trader Adam Erki Enok calculated that September’s average Estonian wholesale price was €74.85/MWh, while solar generators captured a production-weighted price of only €57.77/MWh and wind generators €60.36/MWh.
These figures show that wind and solar output was concentrated disproportionately in lower-priced trading intervals. The distinction between the average market price and the price earned by generators is increasingly relevant to renewable investment, storage and flexible electricity consumption.
It also explains why higher renewable production and higher monthly electricity prices can occur simultaneously. Additional local supply may reduce prices substantially during certain intervals without eliminating the need for more expensive generation or imports at other times.
September brought additional pressure from neighbouring markets. Nordic nuclear availability fell to approximately 53% amid maintenance at several reactors, while European natural gas prices rose sharply. The Dutch TTF front-month contract averaged €74.87/MWh, 22% above August.
These conditions increased the cost of electricity available when renewable production was insufficient.
The contribution of renewables should therefore not be confused with the final price outcome. Without the additional wind and solar generation, September’s prices could have been higher still.
October brought record wind, but the price divide remained
The first full week of October offered an early indication of how the market might behave during autumn.
Between 5 and 11 October, Lithuania recorded a new instantaneous wind-generation record of 2,245 MW. Wind farms produced 167 GWh during the week, more than twice the previous week’s output. Domestic generation covered 91% of electricity demand, imports declined and exports increased.
The average wholesale price nevertheless rose by 9% from the preceding week to €80/MWh.
That was considerably below September’s monthly average of €109/MWh, suggesting that stronger local supply helped ease market conditions. But it also demonstrated that high domestic generation does not, by itself, determine the price paid in a connected market.
More importantly for the Baltic price divide, Latvia averaged €78/MWh during the week, while Estonia was substantially cheaper at €46/MWh.
Even after September’s maintenance period and amid exceptionally strong wind generation, the north–south price difference remained visible.
What winter futures suggest
The approaching winter will test how persistent the Baltic price divide is under higher seasonal demand and reduced solar generation.
Electricity futures provide a market-based indication of expectations, although they are not guarantees of future spot prices.
Settlement data for 16 October 2026 placed Nordic system futures at approximately €109/MWh for November, €114/MWh for December and €129/MWh for January and February. The first-quarter 2027 contract stood at €117.60/MWh.
The Nordic system price, however, is not the same as the price in Finland. Combining system futures with Finnish electricity price-area derivatives gives indicative Finnish prices of approximately €74/MWh for November, €83/MWh for December and €121/MWh for January. The corresponding first-quarter estimate is around €108/MWh.
These figures suggest that the market expects considerably more expensive northern electricity during the main winter months than Finland’s September average of €57/MWh. They are not forecasts for Estonia, Latvia or Lithuania, whose prices will also depend on transmission constraints and local market conditions.
Lower solar generation, weather-dependent wind output, Nordic hydro and nuclear availability, gas prices and winter demand will determine how the market develops. Strong wind can still bring substantial price reductions, while periods of low renewable output and high demand can produce renewed price spikes.
The Baltic price clusters may also converge temporarily, as they did in January 2026. Their separation is not an immutable feature of the electricity system.
The more important change is that price convergence can no longer be taken for granted across the three Baltic countries.
September confirms the market structure that has emerged over the past year: Latvia and Lithuania continue to trade at almost identical prices, while Estonia increasingly occupies a cheaper northern position. What began as a noticeable price difference has become a recurring feature of the Baltic electricity market — and one that matters for electricity buyers, producers and investors as winter approaches.
Sources: AST electricity market reviews; Litgrid September 2026 market review; Litgrid October wind-generation report; Adam Erki Enok’s September capture-price calculations; Latvenergo electricity market review, October 2026; Nordic electricity futures and Finnish EPAD data.