Baltic labour markets in H1 2026: Lithuania adds jobs, Latvia adds second jobs, Estonia struggles with youth unemployment
Across the Baltics, ageing and a shrinking domestic labour base are tightening labour supply. By mid-2026, however, the pressure was showing up very differently in each of the three markets.
All three Baltic countries entered 2026 with small year-on-year increases in employment. Three months later, only Lithuania had sustained and strengthened that growth. Latvia and Estonia had both slipped slightly below their year-earlier employment levels.
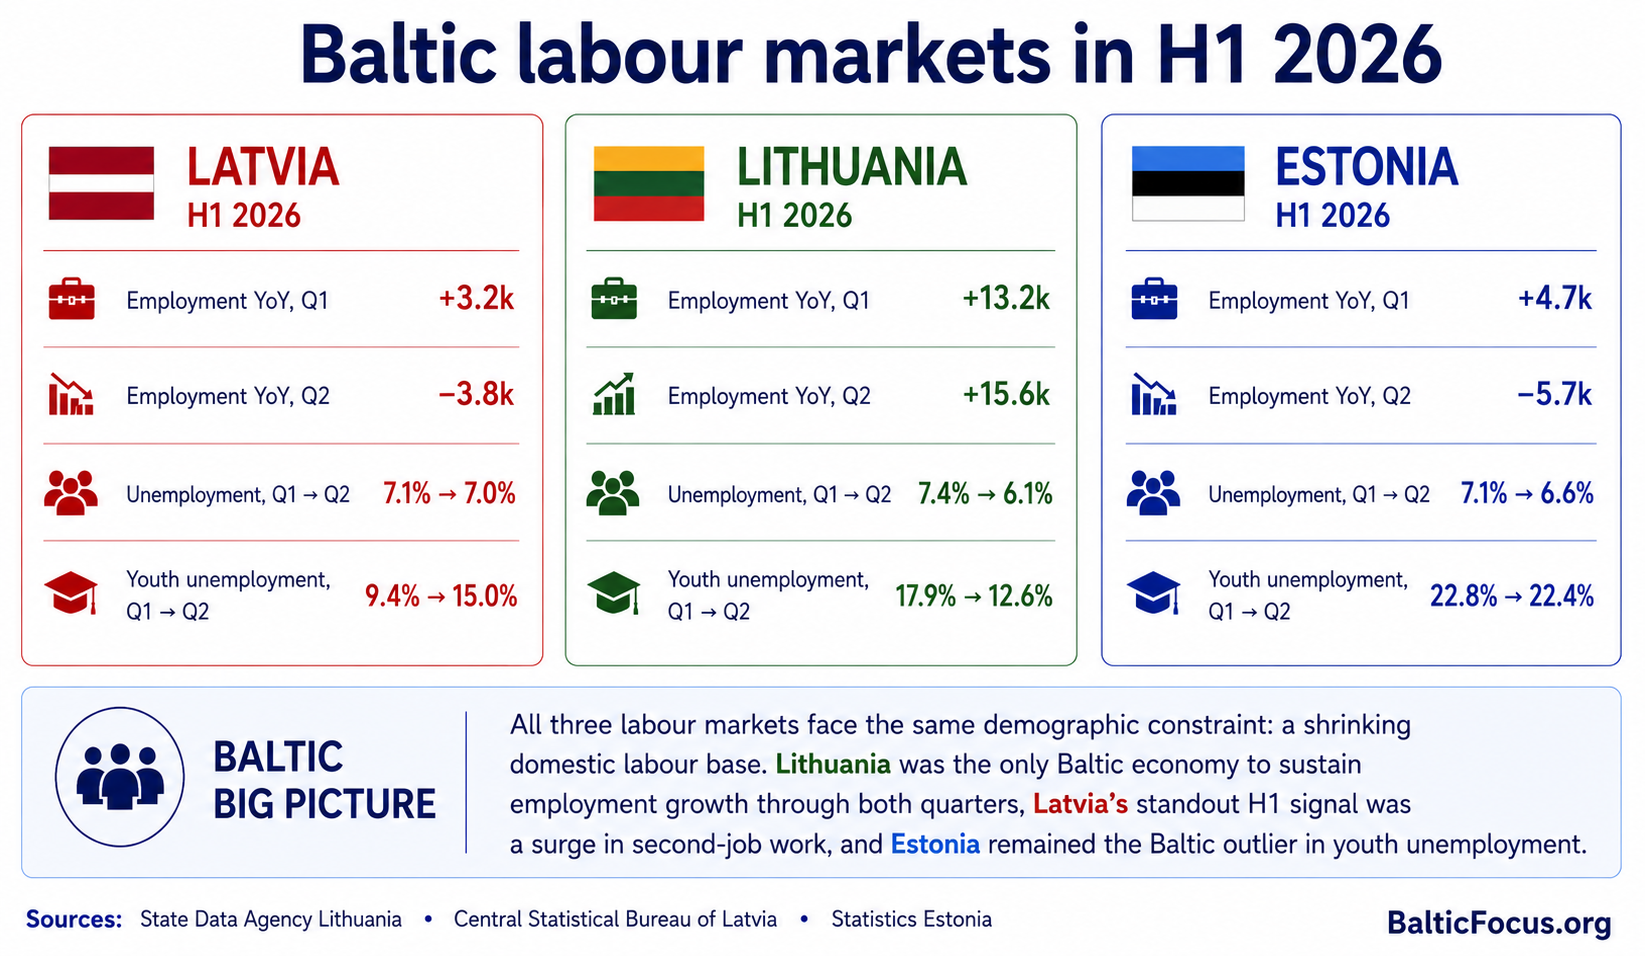
The differences are becoming harder to capture through headline unemployment alone. Lithuania ended Q2 with the lowest unemployment rate and continued to add jobs. Latvia’s employment growth stalled, but the number of people working an additional job rose sharply. Estonia lowered overall unemployment while youth unemployment remained above 22%.
The common backdrop is demographic. Ageing populations and weak natural population growth mean that none of the three countries can assume an expanding domestic supply of workers. Migration, participation and people staying in work longer can change the picture, but the underlying constraint is becoming increasingly visible.
Our Q1 review had already shown that similar unemployment rates were hiding very different pressures. By mid-year, some of those signals had faded and others had become considerably stronger.
| Indicator | Lithuania | Latvia | Estonia |
|---|---|---|---|
| Employment YoY, Q1 2026 | +13.2k | +3.2k | +4.7k |
| Employment YoY, Q2 2026 | +15.6k | −3.8k | −5.7k |
| Unemployment, Q1 → Q2 | 7.4% → 6.1% | 7.1% → 7.0% | 7.1% → 6.6% |
| Youth unemployment, Q1 → Q2 | 17.9% → 12.6% | 9.4% → 15.0% | 22.8% → 22.4% |
| Main H1 signal | Employment growth sustained | Second-job work surges | Youth unemployment remains exceptionally high |
Sources: State Data Agency Lithuania; Central Statistical Bureau of Latvia; Statistics Estonia. Labour Force Survey data for Q1 and Q2 2026.
Lithuania: employment growth survives the H1 test
Lithuania had the least straightforward Baltic labour-market picture at the start of the year.
Employment was already 13.2 thousand higher than a year earlier in Q1, but unemployment had risen to 7.4%. The labour force had expanded faster than employment, leaving open the question of whether Lithuania was developing a mismatch between workers and jobs or simply absorbing a larger active population with a delay.
Q2 made the picture much clearer.
According to Lithuania’s State Data Agency, 1.4756 million people were employed in Q2, 15.6 thousand more than a year earlier and 14.7 thousand more than in Q1. Unemployment fell to 6.1%, while youth unemployment dropped from 17.9% to 12.6%.
Lithuania therefore did more than post one good quarterly number. Employment growth continued through both quarters and strengthened by mid-year.
That brings another question into view: where are the additional workers coming from?
Migration is an obvious part of Lithuania’s labour-market equation, particularly in labour-intensive sectors such as manufacturing, construction and transport. But current H1 data do not allow its contribution to employment growth to be separated cleanly from changes in participation and the resident workforce.
The first July figures, already outside the H1 period, suggest that the next phase may be more selective.
Lithuania’s Employment Service recorded 15.2 thousand new vacancies in July, around 4% fewer than a year earlier. Yet manufacturing still accounted for 3.2 thousand vacancies and construction for 1.6 thousand, with another 1.1 thousand in transport and storage.
The cooling in recruitment is therefore uneven. Manufacturing remains the largest source of registered vacancies, and demand in construction is also persistent. At management level, construction and manufacturing managers were among the most sought-after occupations.
Lithuania’s story is becoming more specific than simply having the strongest Baltic employment numbers: jobs are still being added while labour demand remains concentrated in sectors that cannot rely on an unlimited domestic pool of new workers.
Latvia: employment stalls as second-job work surges
Latvia also began 2026 with a small year-on-year increase in employment. By Q2, that gain had disappeared.
The Central Statistical Bureau recorded 885.5 thousand employed people in Q2, 3.8 thousand fewer than a year earlier. Unemployment barely moved, from 7.1% in Q1 to 7.0% in Q2.
The most striking Latvian figure sits elsewhere.
In Q1, 57.0 thousand people had an additional job. By Q2, the number had reached 67.7 thousand, or 7.7% of all employed residents. That was 10.7 thousand more than three months earlier and 40.3% more than a year ago.
The figures do not tell us why people are taking additional jobs. They do not distinguish neatly between conventional second jobs, several part-time positions and other forms of additional work. Nor should the increase automatically be interpreted as financial distress.
But the movement itself is hard to ignore. While Latvia’s small year-on-year employment gain had disappeared by Q2, multiple-job employment rose sharply.
Other Q1 signals moved in different directions.
Youth unemployment had fallen to an unusually low 9.4% in Q1, but rose to 15.0% in Q2. Youth employment itself did not collapse. The number of employed 15–24-year-olds increased from 59.6 thousand to 62.7 thousand.
More young people were therefore working, but more were also entering the labour market and looking for work.
Long-term unemployment improved. It fell from 25.8 thousand people in Q1 to 21.6 thousand in Q2, reversing one of the more worrying signals from the beginning of the year.
Age is changing the workforce as well.
Among people aged 20–64, employment was 12.9 thousand lower than a year earlier, considerably more than the 3.8 thousand decline across the broader 15–74 population. At the same time, the employment rate among 65–74-year-olds rose by 2.6 percentage points to 27.6%.
The number of economically inactive people also declined by 8.9 thousand year on year. That cannot simply be translated into 8.9 thousand previously inactive residents returning to work. Older people staying employed longer, migration, movement between age groups and population decline all change the composition of both the active and inactive population.
Latvia’s demographic backdrop makes that distinction important. The population fell by 15.5 thousand in 2025. Negative natural change accounted for 14.2 thousand of the decline, while net migration was also negative. The working-age share of the population fell, while the share aged 65 and over increased.
Latvia therefore ended H1 without sustained year-on-year employment growth, but with substantial movement inside the workforce. The strongest new signal is the surge in second-job work. Alongside it, older workers are becoming more visible and the composition of the active population continues to change.
For now, the figures are more useful as a signal than as proof of one single explanation.
Estonia: youth remains the pressure point
Estonia’s reversal was sharper.
Employment was still 4.7 thousand higher than a year earlier in Q1. By Q2, it was 5.7 thousand lower. Yet overall unemployment improved from 7.1% to 6.6%.
The strongest warning signal remains among young people.
Youth unemployment stood at 22.8% in Q1 and 22.4% in Q2. The slight improvement did little to change Estonia’s position in the region: Latvia was at 15.0% and Lithuania at 12.6%.
Youth employment did recover from the exceptionally weak first quarter. The employment rate for 15–24-year-olds increased from 28.6% to 33.8%, and Statistics Estonia reported 3.3 thousand more employed young people than a year earlier.
The problem is therefore not simply that young people are disappearing from employment. More than one in five economically active young people still remained unemployed in Q2.
That is a particularly uncomfortable number in a country already facing a shrinking domestic labour base. A shortage of potential workers and high youth unemployment can coexist: the issue is not only how many workers are available, but whether the economy can absorb those already trying to enter it.
The broader picture points in the same direction.
The number of economically inactive people was 13.1 thousand higher than a year earlier, while labour-force participation fell by 1.4 percentage points to 73.4%. Statistics Estonia also reported an increase in inactivity related to health.
Employment remained uneven by sector. Services lost employed people year on year, while industry and construction were broadly stable — a pattern already visible in Q1.
One geographical figure stands out: Tallinn alone had 5.8 thousand fewer employed people than a year earlier, slightly more than Estonia’s entire net employment decline. The available data do not provide enough sector detail for Tallinn to explain what is driving that fall, so the geographical concentration is best treated as a signal rather than a diagnosis.
Estonia’s demographic background has also become less supportive. Its population fell by 9,250 people in 2025. Negative natural change accounted for 6,448 of the decline, while net migration turned negative at −2,802.
By mid-year, Estonia therefore looked stronger through its headline unemployment rate than through employment, participation and, above all, the position of young people in the labour market.
Demography sets the constraint, not the outcome
The first half of 2026 does not show one Baltic labour-market cycle.
Lithuania continued to add employment and still has visible demand in manufacturing and construction. Latvia lost its small Q1 employment gain while second-job work accelerated sharply. Estonia also moved from a small annual employment increase to a decline, while youth unemployment remained above 22%.
Nor does the evidence point to a common Baltic industrial employment downturn. Lithuanian manufacturers remain active recruiters, while Estonian industry and construction have held up better than services.
The common problem sits deeper.
Demography makes the domestic labour pool harder to expand. It does not decide how effectively an economy uses the labour available to it.
Migration can add workers. Older people can stay in work longer. Participation can rise or fall. Employers can absorb new workers, fail to match them to vacancies or make more intensive use of people already employed.
By mid-2026, Lithuania was the only Baltic economy still turning that constrained labour supply into clear year-on-year employment growth. Latvia and Estonia were not facing an employment collapse, but both had lost the small gains visible at the start of the year.
The Baltic labour-market divide is increasingly about labour absorption under demographic pressure: who is available to work, who finds work, and how intensively the existing workforce is being used.
Primary source
State Data Agency Lithuania; Central Statistical Bureau of Latvia; Statistics Estonia
Labour Force Survey data for Q1 and Q2 2026