Cheaper Butter, Dearer Fuel: Why Baltic Inflation Is Pulling Apart
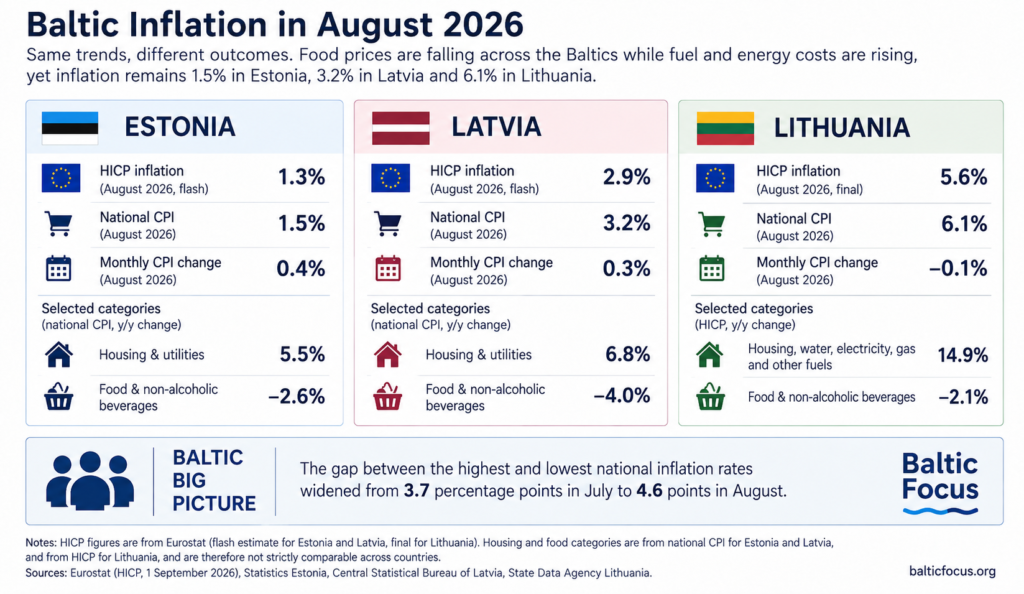
Food prices are falling across the Baltics while fuel costs are rising. Yet annual inflation in August ranged from 1.5% in Estonia to 3.2% in Latvia and 6.1% in Lithuania. The difference lies less in the direction of individual prices than in what surrounds them: taxes, heating costs, services, base effects and different energy-price conditions.
Butter was 28% cheaper than a year earlier in Estonia and 23.2% cheaper in Latvia. Latvian cheese was down 8.3%. At the same time, diesel cost 27.9% more in Estonia and 24.5% more in Latvia.
Food and non-alcoholic beverages were 2.6% cheaper year on year in Estonia and 4.0% cheaper in Latvia. Lithuania’s harmonised index showed a 2.1% decline in the same category. Yet headline inflation moved further apart rather than closer together.
DATA CARD — August 2026
| National CPI | Annual | Monthly |
|---|---|---|
| Lithuania | 6.1% | −0.1% |
| Latvia | 3.2% | +0.3% |
| Estonia | 1.5% | +0.4% |
Sources: State Data Agency Lithuania, Central Statistical Bureau of Latvia, Statistics Estonia.
The gap between the highest and lowest national inflation rates widened from 3.7 percentage points in July to 4.6 points in August.
In July, Baltic Focus described the region as having three different inflation architectures. August has not overturned that picture. It has made the mechanisms behind the divergence easier to see.
Lithuania: food is no longer the problem
Lithuania is the obvious outlier. Its national CPI reached 6.1% in August, while harmonised inflation was 5.6%. Food prices were falling, but several other pressures remained strong.
Lietuvos bankas points first to energy. Across April–July, the central bank’s broad energy aggregate rose by an average 21.5% year on year, more than twice the EU pace. Fuel was the largest contributor, while heating added another specifically Lithuanian pressure.
Heat energy prices were 42% higher year on year in July. Higher fuel costs played a role, but so did taxation: from January Lithuania abolished the reduced VAT rate on heating, raising it from 9% to 21%.
The August HICP shows that energy-related pressure remained visible across several parts of the consumer basket, although these categories are not directly comparable with the central bank’s broader April–July energy aggregate. Housing, water, electricity, gas and other fuels were 14.9% more expensive than a year earlier, while transport prices were up 13.4%.
Tax effects extend beyond heating. Lithuania entered 2026 with higher excise duties, changes to energy taxation and a new contribution on non-life insurance, among other measures.
Using HICP at constant tax rates, Lietuvos bankas estimates that indirect-tax changes added around 1.3 percentage points to annual inflation. Without that effect, the central bank says Lithuania would sit roughly in the middle of the EU inflation distribution rather than near the top.
Domestic price pressure is also stronger than in its Baltic neighbours. Lietuvos bankas calculated service inflation at an average 6.6% year on year in April–July, linking it to rapid wage and labour-cost growth while productivity provided only limited relief. Strong household demand has also made it easier for businesses to pass higher costs on to consumers; the bank identifies withdrawals from Lithuania’s second-pillar pension system as one factor supporting consumption.
The August data show that the pressure is spread across several categories. Recreation, sport and culture was 6.6% more expensive year on year, restaurants and accommodation 5.7%, and personal care and miscellaneous services 6.0%.
Food is moving in the other direction. Lietuvos bankas had already noted that food excluding non-alcoholic beverages was on average 0.4% cheaper year on year in April–July, compared with a 1.2% rise in the EU. The August HICP decline of 2.1% strengthened that trend.
Lithuania’s inflation therefore reflects several pressures operating at once: taxes, expensive heating and fuel, and persistent service and labour-cost growth. Cheaper groceries are offsetting part of them, but not enough to dominate the index.
Latvia: energy pushes, food pulls back
Latvia’s August figure of 3.2% comes from a narrower balance.
The Central Statistical Bureau’s contribution data are unusually clear. Transport added 1.1 percentage points to annual inflation, and housing, water, electricity, gas and other fuels added another 1.1 points. Food and non-alcoholic beverages moved in the opposite direction, subtracting 0.9 points.
DATA CARD — What moved Latvian inflation?
| Contribution to annual CPI | August 2026 |
|---|---|
| Transport | +1.1 pp |
| Housing & energy | +1.1 pp |
| Food & non-alcoholic drinks | −0.9 pp |
Source: Central Statistical Bureau of Latvia.
Transport prices were 8.6% higher than a year earlier. Fuel was up 22.1%, including a 24.5% increase in diesel and 18.3% in petrol. Housing-related prices rose 6.8%, with district heating up 8.8%, natural gas 16.6%, solid fuels 13.3% and electricity 3.2%.
Food moved strongly in the opposite direction. Prices were 4.0% lower than a year earlier, with butter down 23.2%, cheese 8.3%, bread 6.3% and low-fat milk 14.4%.
Part of the decline reflects market prices, but Latvia also cut VAT on bread, milk, poultry and eggs from 21% to 12% from 1 July. After the July data, Luminor economist Pēteris Strautiņš estimated that roughly two-thirds of Latvia’s 0.7% monthly decline in consumer prices could be explained by cheaper food, combining the VAT reduction with seasonal effects. He also expected the one-off impact of the tax change to fade and energy and services to regain importance in the following months.
Services remain relatively expensive. Restaurant and accommodation prices were 7.6% higher year on year, recreation, sport and culture 6.5%, health services 4.2%, and the broad personal-care and miscellaneous-services category 5.1%.
But Latvia does not currently show the same breadth of domestic price pressure as Lithuania. In August, energy-sensitive categories were doing most of the work upwards, while food was pulling hard in the opposite direction.
Estonia: the inflation pressure has faded elsewhere
Estonia reached just 1.5% annual inflation even though fuel was becoming significantly more expensive.
Eesti Pank economist Lauri Matsulevitš points first to the comparison base. The motor vehicle tax, higher VAT and higher excise duties added around two percentage points to inflation last year. The VAT effect remained in the annual comparison until June 2026 and has now dropped out.
Food is another major factor. Food and non-alcoholic beverages account for around 22% of Estonia’s consumer basket and were 2.6% cheaper than a year earlier in August. Eesti Pank links the decline in dairy prices partly to increased European production following the earlier period of high prices.
The fall is broader than food. Clothing and footwear prices were 4.6% lower than a year earlier, while recreation was 3.4% cheaper. Eesti Pank has also noted falling prices for a range of imported manufactured goods.
Services are an even sharper contrast with Lithuania. Eesti Pank estimates service inflation at around 2%, after it had approached 10% last year. Statistics Estonia put services overall 2.4% higher year on year in August.
Energy, meanwhile, was still the largest positive contributor to Estonia’s inflation. Petrol was 7.9% more expensive than a year earlier and diesel 27.9% more expensive. Eesti Pank links the sharp diesel increase partly to higher refining margins and Europe’s dependence on external diesel supplies, with import disruptions since spring.
Estonia is therefore not avoiding higher fuel costs. They are being offset by weaker price growth — or outright price declines — elsewhere in the basket.
The electricity divide underneath
The CPI figures sit on top of an electricity-market split that has already been visible since spring.
In August, Estonia’s average wholesale electricity price was €58.88/MWh, compared with €79.78/MWh in Latvia and €79.84/MWh in Lithuania. Finland averaged €41.26/MWh.
DATA CARD — August wholesale electricity
| Average price | |
|---|---|
| Finland | €41.26/MWh |
| Estonia | €58.88/MWh |
| Latvia | €79.78/MWh |
| Lithuania | €79.84/MWh |
Source: Baltic Focus August electricity-market review.
Estonia has remained more exposed to cheaper Finnish and Nordic prices, while limited Estonia–Latvia transmission capacity restricts how much of that lower price can move south. Latvia and Lithuania, by contrast, have spent much more time in the same price area.
Wholesale electricity does not pass directly into the same month’s consumer price index. Estonia itself shows why: Eesti Pank says August wholesale electricity prices were around a quarter lower than a year earlier, while the final price paid by consumers still rose slightly because fixed-price packages were more expensive and new system charges had been introduced.
The electricity split nevertheless matters. All else equal, a persistently higher retail electricity price raises household energy costs directly and can also feed into business and service costs. What it does not do is explain the entire Baltic inflation gap. Taxes, heating structures, food prices, wages and services determine how much of the underlying energy environment reaches the final CPI.
That distinction will become more useful as the heating season begins. Lithuania enters autumn with heating already carrying a substantial tax and cost effect. Latvia has housing and transport providing much of its current inflation pressure. Estonia remains exposed to a different wholesale electricity environment, while much weaker service inflation and favourable base effects are keeping its headline rate low.
The wholesale split will not determine Baltic inflation on its own. But it gives the three economies different starting conditions as autumn energy demand rises — and August suggests that those differences are still widening rather than disappearing.