Baltic retail diverged in H1 2026: Lithuania pulled ahead, Latvia lost momentum, Estonia stabilised
Retail trade expanded across the Baltic states in the first half of 2026, though the available national releases do not form a fully harmonised three-country dataset.
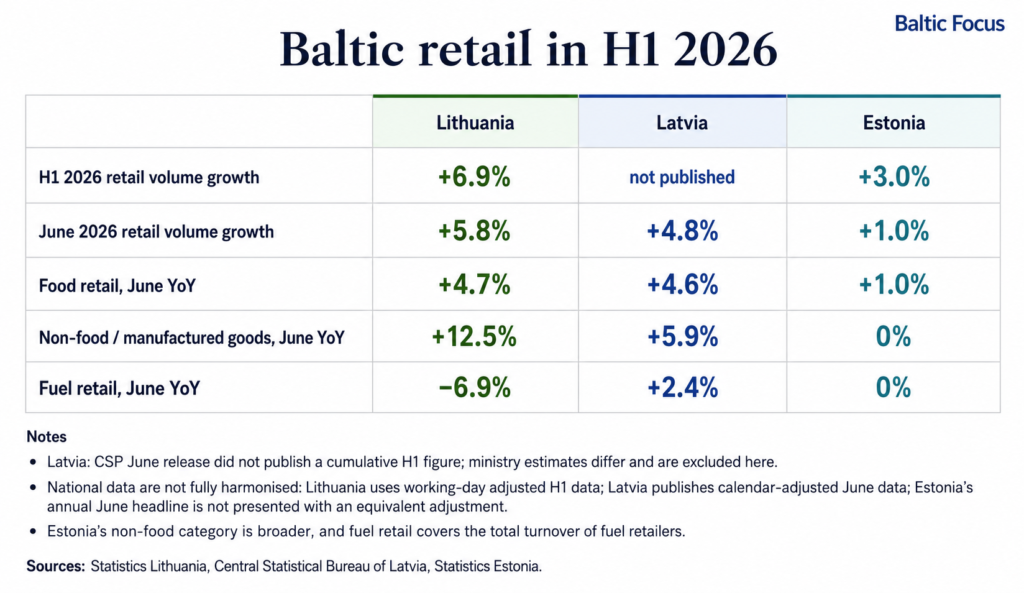
Lithuania reported the strongest first-half retail growth in the Baltic states, led by non-food sales. Latvia ended June with broad annual growth, though retail volumes weakened during the second quarter. Estonia recorded a slower recovery, with grocery sales returning to growth only after more than two years of decline.
Retail trade expanded across the Baltic states in the first half of 2026, though the available national releases do not form a fully harmonised three-country dataset.
Lithuania’s statistics agency reported 6.9% growth in January–June, adjusted for the number of working days. Statistics Estonia reported 3% growth over the same period. Latvia’s Central Statistical Bureau published detailed June and monthly data, without a cumulative first-half total in its release. Latvia’s Economy Ministry later calculated H1 growth at 4.5%, while the Finance Ministry reported 4.4% and produced a different segment breakdown. These ministerial estimates are excluded from the main comparison.
The cleanest common snapshot is June. Compared with June 2025, retail volumes increased by:
- 5.8% in Lithuania
- 4.8% in Latvia
- 1% in Estonia
The national adjustments differ. Lithuania removes working-day effects, Latvia publishes calendar-adjusted annual data, while Estonia’s headline annual result is not presented with an equivalent adjustment. The figures show the scale and direction of the gap rather than a final harmonised ranking.
Lithuania: non-food retail widened the lead
Lithuania’s first-half result was driven primarily by non-food sales.
Between January and June:
- total retail increased by 6.9%;
- non-food retail increased by 12.1%;
- online and mail-order sales increased by 21.9%;
- food retail increased by 2.4%;
- automotive fuel retail increased by 2.5%.
The June pattern was even sharper. Non-food sales rose by 12.5% year on year, compared with 4.7% for food. Clothing and textiles grew by 11.4%, the broad household-equipment category by 14.4%, and pharmaceutical, medical and cosmetic goods by 11.9%.
Lithuania’s growth also coincided with the release of second-pillar pension savings. Before the withdrawals began, the Bank of Lithuania projected that around €1.2 billion could enter the economy in 2026 and temporarily accelerate private consumption growth to 5%. Its April outlook continued to treat the pension reform as an additional source of consumer demand.
Those forecasts establish a credible transmission mechanism. They do not show how many percentage points of the observed 6.9% retail growth came from pension money. Rising wages, credit, confidence, fiscal policy and ordinary replacement purchases also affected household demand.
The defensible conclusion is therefore limited:
Pension withdrawals probably strengthened Lithuanian consumption, while their precise contribution to retail growth remains unmeasured.
The composition of spending matters as well. Retail turnover captures the sale of imported goods, though only the domestic trade margin and related services contribute directly to Lithuanian value added. Pension liquidity can lift retail, imports and domestic output in different proportions.
Latvia: June improved, quarterly momentum weakened
Latvia’s June result was broad:
- total retail: +4.8%;
- food: +4.6%;
- non-food excluding fuel: +5.9%;
- automotive fuel: +2.4%.
Online and mail-order sales increased by 18.6%, hardware and construction-related goods by 11.8%, and household electrical appliances by 9.6%. ICT equipment sales fell by 8.2%, while sales through stalls and markets declined by 4.5%. All figures come directly from the Central Statistical Bureau’s calendar-adjusted series.
The monthly result looks stronger than the quarterly trajectory. A Latvijas Banka commentary, citing seasonally adjusted CSP data, reports that retail turnover fell by 0.8% in the second quarter compared with the first. Household assessments of their financial position also deteriorated during the quarter, while day-to-day spending grew more slowly than deposits.
Latvijas Banka proposes several alternative destinations for household expenditure: vehicles, housing, services, travel and purchases through businesses classified outside retail trade. These channels are plausible. The commentary does not quantify their combined scale or demonstrate that they account for the loss of retail momentum.
Housing credit offers a particularly weak direct explanation. The purchase price of a dwelling does not enter retail turnover. A housing transaction may generate later demand for furniture, appliances, building materials and renovation, though this effect should appear in the relevant retail categories.
The Latvian evidence points to a simpler reading:
Retail remained above last year’s level, while household demand lost momentum during the second quarter.
Pressure on purchasing power is likely to be uneven. Average income statistics can improve while households below the mean face tighter budgets because food, housing, utilities, transport and medicines absorb a larger share of their income. The available data do not support the claim that Latvian consumers merely replaced shopping with apartments, cars and holidays.
Why Latvia has no H1 number in the comparison
The CSP release of 29 July does not provide a cumulative January–June result. It supplies monthly indices in the official database and detailed June comparisons.
The Economy Ministry subsequently reported H1 growth of 4.5%, with food at 1.9%, non-food at 6.2% and fuel at 4.9%. The Finance Ministry reported 4.4%, with food at 2.2%, non-food at 5.7% and fuel at 5%. Both ministries referred to CSP data, yet their totals and segment calculations differ. Baltic Focus therefore does not use either ministerial result as the Latvian statistical baseline.
Estonia: food sales ended a two-year decline
Estonia’s retail volume increased by 3% in the first half of 2026 and by 1% year on year in June.
The June increase came from grocery stores, where sales volume rose by 1%. This was the first annual increase since March 2024. Sales at stores selling manufactured goods remained at the previous year’s level.
The result marks a stabilisation of basic household consumption. The recovery remained narrow: food returned to growth, while manufactured-goods sales failed to expand.
Detailed comparison with Latvia and Lithuania is also limited by Estonia’s publication changes. From 2026, Statistics Estonia no longer releases the former detailed breakdown of grocery and manufactured-goods activities. Retail statistics still use EMTAK 2008, while the business register has moved to EMTAK 2025, leaving several activity groups only partly comparable.
Fuel moved in opposite directions in June
Automotive fuel retail showed the sharpest monthly divergence:
- Lithuania: −6.9%
- Latvia: +2.4%
- Estonia: unchanged
Lithuania’s decline applies only to June. Fuel retail still increased by 2.5% over the first half as a whole.
The Estonian category also covers the total turnover of enterprises classified as automotive-fuel retailers, including food service and other goods and services sold at filling stations. It is not a clean measure of litres of fuel purchased.
The contrast deserves attention, though it cannot yet be explained through retail data alone. Fuel prices, traffic volumes, tourism, commercial transport and cross-border purchasing would need to be examined separately.
Baltic big picture
Lithuania opened the widest retail lead in H1 2026 through rapid non-food growth, against the exceptional background of pension withdrawals. Latvia’s June figures remained positive across the main segments, while the quarterly decline exposed weaker consumer momentum. Estonia moved back into growth more slowly, with the June improvement concentrated in grocery sales.
The data show divergence in scale and composition. They do not yet provide a complete causal decomposition. Lithuania’s pension impulse, Latvia’s pressure on household budgets and Estonia’s narrow recovery are the central lines to monitor during the second half of 2026.