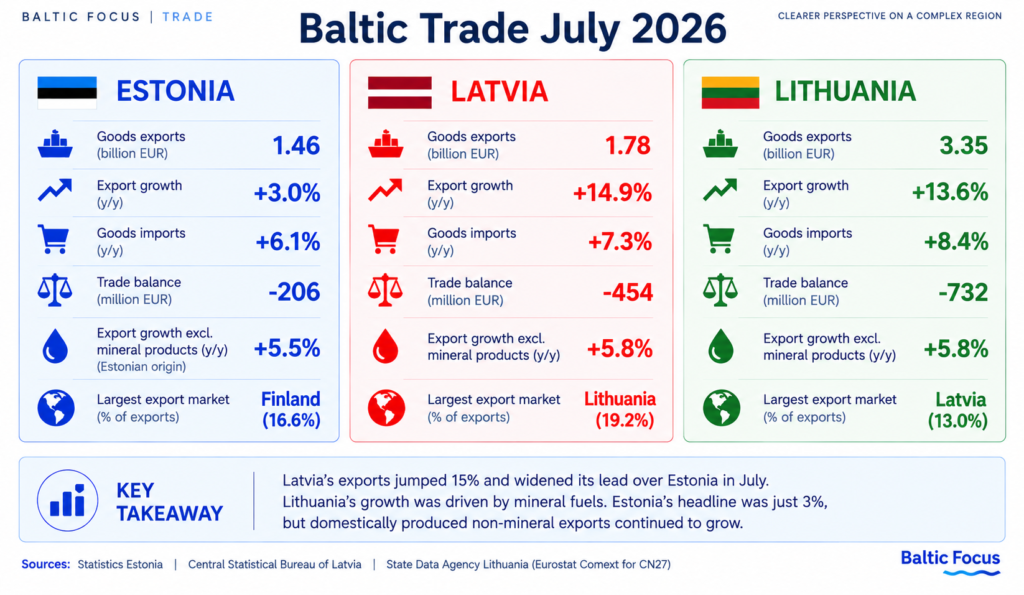
Latvia’s Exports Jump 15%. Estonia’s Rise Just 3%. The Headline Numbers Mislead
July interrupted Estonia’s return towards export parity with Latvia. But the underlying numbers show why gross export growth alone gives an incomplete picture of the Baltic economies.
In August, Baltic Focus asked whether Estonia was about to reclaim the export position it lost after 2022.
The gap with Latvia had narrowed to just €380 million in the first half of 2026, as Estonian goods exports grew 8% year on year compared with 5.8% in Latvia.
July interrupted that convergence — at least in gross export values. Latvia exported about €321 million more goods than Estonia during the month, adding almost another first-half-sized margin to the gap.
But July also strengthened the reason to look beyond the headline numbers.
| July 2026 goods exports | Latvia | Lithuania | Estonia |
|---|---|---|---|
| Export value | €1.78bn | €3.35bn | €1.46bn |
| YoY growth | +14.9% | +13.6% | +3.0% |
| Main structural factor | Fuel re-export + machinery | Mineral fuels / domestic processing | Singapore mineral shipment + lower re-exports |
| Other signal | Machinery & electrical +25.5% | LT-origin ex-minerals +4.2% | EE-origin ex-minerals +5.45% |
The final row is not directly comparable across countries: Latvia does not publish the same monthly domestic-origin breakdown available for Lithuania and Estonia.
Signal: Latvia clearly widened its lead in gross exports. The structure underneath those numbers is much less straightforward.
Latvia: strong growth, partly driven by redistribution
According to Latvia’s Central Statistical Bureau, mineral products, machinery and electrical equipment, and transport together accounted for almost four-fifths of the country’s export increase.
The mineral surge deserves particular attention.
Exports of selected motor-gasoline codes rose by €44.5 million, accounting for almost one-fifth of Latvia’s total export growth.
Latvia has no refinery producing this gasoline. The increase therefore contains an identifiable re-export component rather than Latvian fuel production.
That does not invalidate the broader July result. Machinery and electrical equipment also expanded strongly, while transport exports increased. The composition is mixed: part redistribution, part growth in other export categories.
There was also a counter-signal from one of Latvia’s traditional export industries. Wood and wood products declined, with wood-pellet exports down by €16 million, or 52.1%.
Lithuania: a larger fuel effect — but a different one
Lithuania recorded the largest absolute export increase of the three Baltic states in July.
Eurostat Comext data show that CN27 — mineral fuels, oils and related products — contributed €264.6 million, or 65.9% of the country’s total export increase. All other goods combined added €137.1 million.
The latest Comext extraction and Lithuania’s original September release differ on the precise year-on-year CN27 growth rate. Baltic Focus therefore uses the internally consistent Comext value series for the contribution calculation rather than combining different data vintages.
Lithuania’s fuel effect is also structurally different from Latvia’s gasoline re-export.
Between January and July, 83.2% of Lithuania’s CN27 exports were classified as goods of Lithuanian origin. That ratio cannot be applied mechanically to July alone, but it shows that domestic processing is a structural part of Lithuania’s fuel-export base.
The non-energy economy was still expanding. Lithuania’s State Data Agency reported July growth of 5.8% for exports excluding mineral products and 4.2% for Lithuanian-origin exports excluding minerals.
Lithuania’s 13.6% headline was therefore heavily energy-driven, but it was not an energy-only story.
Estonia: the weakest headline hides a stronger domestic signal
Estonia presents almost the opposite problem.
Exports to Singapore increased by more than Estonia’s entire net export gain. A single customs line, CN27079999, accounted for €52.5 million of exports to Singapore compared with zero a year earlier.
Statistics Estonia linked the Singapore increase to mineral products including shale oil. The customs code itself is broader than shale oil, so the full amount cannot be independently attributed to shale oil alone.
Mechanically excluding that one flow would leave the rest of Estonia’s exports slightly below their July 2025 level.
But origin changes the picture.
Estonian-origin exports excluding mineral products increased by €43.4 million, or 5.45%. Mineral products accounted for less than half of the increase in exports of Estonian-origin goods.
At the same time, Estonia’s total mineral exports actually declined. Growth in domestically produced mineral goods was more than offset by falling mineral re-exports.
This reverses one important feature of the picture Baltic Focus described after the first half of the year. Estonia’s earlier recovery had still contained a substantial re-export component. In July, re-exports were instead dragging down the headline while domestic-origin exports continued to grow.
July did not settle the Baltic export question
In gross merchandise trade, the answer to our August question is clear for now: Estonia did not retake the lead. Latvia moved further ahead.
But July also shows why that ranking cannot be treated as a ranking of underlying export performance.
Latvia’s 14.9% increase combined fuel re-exports with strong machinery growth. Lithuania’s 13.6% was dominated by mineral fuels, but within an export structure where domestic processing plays a much larger role. Estonia’s headline was only 3%, while domestically produced non-mineral exports continued to grow considerably faster.
There is no credible common adjustment that would turn these figures into a second, “true” Baltic league table. The countries publish different origin data, and their export structures are different.
The useful distinction is therefore simpler.
Gross export value tells us who is ahead. Product structure and origin tell us what is driving that position.
In July, Latvia strengthened its lead on the first measure. Estonia’s numbers suggest that the recovery underneath the headline is still very much alive.