Baltic Electricity in July 2026: Why One Cheap Week Could Not Rewrite the Month
Baltic prices fell sharply from June as wind generation strengthened across Northern Europe and the region. They still remained above July 2025 levels in all three Baltic states.
The week spanning 27 July–2 August brought some of the lowest Baltic electricity prices of 2026. Average prices fell to €24.62/MWh in Estonia and about €38/MWh in Latvia and Lithuania, down roughly 49% week on week.
The July averages remained much higher.
| Bidding area | July 2026 | June 2026 | July 2025 |
|---|---|---|---|
| Estonia | €43.93/MWh | €64.40/MWh | €36.63/MWh |
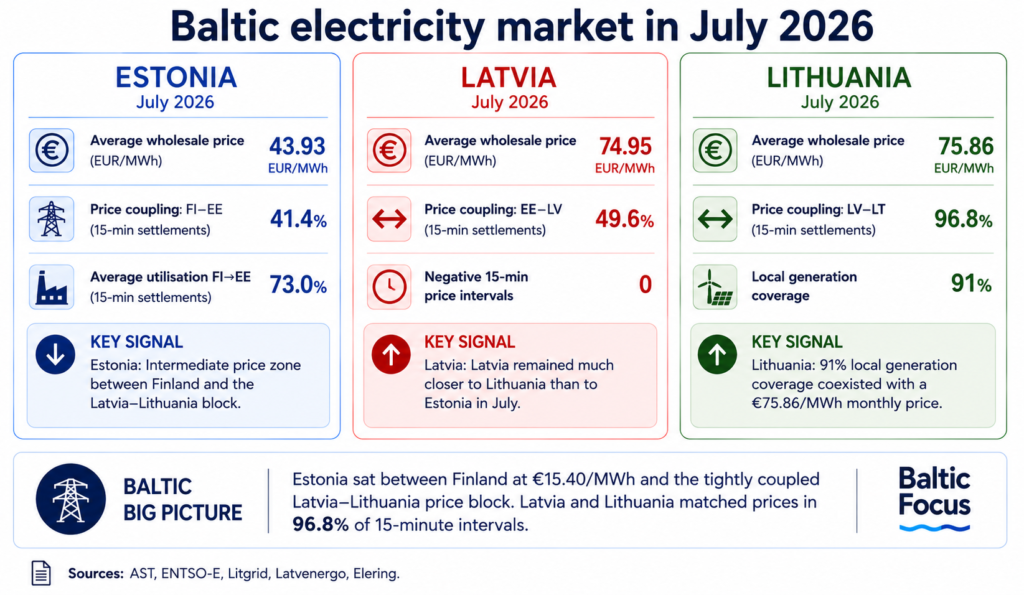
| Latvia | €74.95/MWh | €92.23/MWh | €46.12/MWh |
| Lithuania | €75.86/MWh | €93.71/MWh | €46.29/MWh |
Finland averaged €15.40/MWh in July, compared with €24.14/MWh a year earlier and well below all three Baltic bidding areas.
Baltic prices fell sharply from June as wind generation strengthened across Northern Europe and the region. They still remained above July 2025 levels in all three Baltic states. Weak Nordic hydro conditions added pressure despite strong wind and solar output.
Across the Baltics, domestic generation covered 83% of consumption in July. Wind and solar accounted for 73% of locally generated electricity.
Estonia became the price hinge
The clearest July signal was Estonia’s position between two neighbouring price regions.
| Market border | Equal-price intervals | Average directional utilisation |
| Finland–Estonia | 41.4% | FI→EE 73.0% |
| Estonia–Latvia | 49.6% | EE→LV 74.9% |
| Latvia–Lithuania | 96.8% | LV→LT 29.1% |
Source: AST / ENTSO-E.
The Finland–Estonia and Estonia–Latvia links were heavily used, reaching daily utilisation peaks of 98% and 99.7% respectively. Yet Estonia shared Finland’s price in only 41.4% of 15-minute intervals and Latvia’s in 49.6%.
Estonia therefore operated as an intermediate price zone between Finland and the almost fully coupled Latvia–Lithuania market.
High price convergence between Latvia and Lithuania does not require the interconnector to operate close to full capacity. Available transfer capacity can be sufficient to equalise marginal prices without becoming congested.
The restored EstLink 2 increased Estonia’s access to Finnish electricity. Baltic imports from Finland rose 19.4% from June to 552 GWh, while imports from Sweden fell to 158 GWh and from Poland to 26 GWh.
Estonia remained well below the Latvia–Lithuania price level while imports from Finland increased.
Estonia’s flexibility market is also becoming more visible as renewable penetration increases. According to KratTrade analysis, wind and solar generation briefly reached 274% of domestic consumption on 18 July, while renewable generation averaged 86% of consumption over the full day.
| Estonia, July | €/MWh |
| Average spot price | 43.93 |
| Consumption-weighted price | 41.30 |
| Wind capture price | 38.20 |
| Solar capture price | 29.80 |
Source: KratTrade analysis based on Elering market data.
Solar captured about 68% of the monthly average spot price. KratTrade estimates that participation in ancillary markets could increase revenues for some PV assets by more than 20%. The estimate is company-specific, but the spread between spot and capture prices already points to the commercial value of flexibility.
The lower consumption-weighted price does not by itself prove active demand response. It shows that a larger share of electricity was consumed during relatively cheaper intervals.
Latvia and Lithuania formed the southern price block
Latvia and Lithuania averaged €74.95/MWh and €75.86/MWh respectively. Their prices matched in 96.8% of 15-minute intervals.
Lithuania combined high domestic generation with active cross-border trade.
| Lithuania, July | GWh |
| Domestic generation | 978 |
| Wind | 392 |
| Solar | 381 |
| Imports | 381 |
| Exports | 296 |
Source: Litgrid.
Local generation covered 91% of Lithuania’s electricity demand. Wind and solar together accounted for 79% of domestic production.
Lithuania-to-Poland flows used an average 69.6% of available capacity and reached 100% on the highest day. Poland-to-Lithuania flows averaged only 21.4%.
Lithuania exported electricity during high-output periods and imported at other times.
Litgrid and ESO estimate that the Lithuanian system could require around 3 GW of additional flexibility resources by 2035. The category includes demand response, cross-border exchanges, storage, flexible generation and Power-to-X solutions.
Latvia’s July balance was markedly weaker: local generation covered about 71% of consumption, with 389 GWh produced against 545 GWh consumed. Solar was the largest individual source at about 213 GWh, followed by hydro at 115 GWh and wind at 32 GWh.
Latvia and Lithuania therefore reached almost identical monthly prices despite very different levels of domestic generation coverage: about 71% in Latvia and 91% in Lithuania.
One month contained very different price conditions
The cheap week at the turn of July and August sat at the favourable end of a much wider monthly range.
| July 2026 | Estonia | Latvia | Lithuania |
| Monthly average | €43.93 | €74.95 | €75.86 |
| Lowest daily average | €8.84 | €17.63 | €17.55 |
| Highest daily average | €90.40 | €131.70 | €131.70 |
| Highest 15-min price | €259.35 | €266.43 | €266.43 |
| Negative 15-min intervals | 26 | 0 | 7 |
Source: AST / ENTSO-E.
The intraday spread was equally pronounced. According to Enefit Latvia, almost one-third of July hours in Latvia were priced below €20/MWh. The average between 10:00 and 18:00 was about €29/MWh, compared with €124/MWh between 18:00 and 23:00.
During 27 July–2 August, Baltic wind generation increased by 12% and solar by 26% week on week. Baltic local generation covered 73% of consumption during the period, below the 83% monthly figure.
The price decline reflected a favourable combination of renewable output, low seasonal demand and inexpensive imports rather than exceptionally high local self-sufficiency.
Baltic picture
July exposed a clear market structure.
Finland averaged €15.40/MWh, well below all three Baltic bidding areas. Estonia sat at an intermediate price level despite heavily used connections on both sides. Latvia and Lithuania traded almost as a single price area.
Additional wind and solar capacity will increase electricity supply. Its market value will increasingly depend on transmission capacity, controllable generation, storage, balancing markets and demand that can shift towards periods of abundant renewable output.
Postscript: July personnel moves
The Baltic energy sector also saw several notable personnel changes in July.
Adam Erki Enok moved from Sunly to KratTrade as Head of Trading, shifting from renewable development towards BESS, trading and flexibility optimisation. A second senior manager also left Sunly during the period.
In Lithuania, Andrius Kavaliauskas became CEO of Ignitis. The country also saw a change in its political energy leadership during July.
Sources: AST — Electricity Market Review | Latvenergo — weekly electricity price review | Litgrid — Lithuania system data and monthly market reviews | Litgrid / ESO — flexibility needs to 2035 | KratTrade analysis based on Elering market data.