Statistic · Industry & Manufacturing
Baltic manufacturing split widens in June 2026
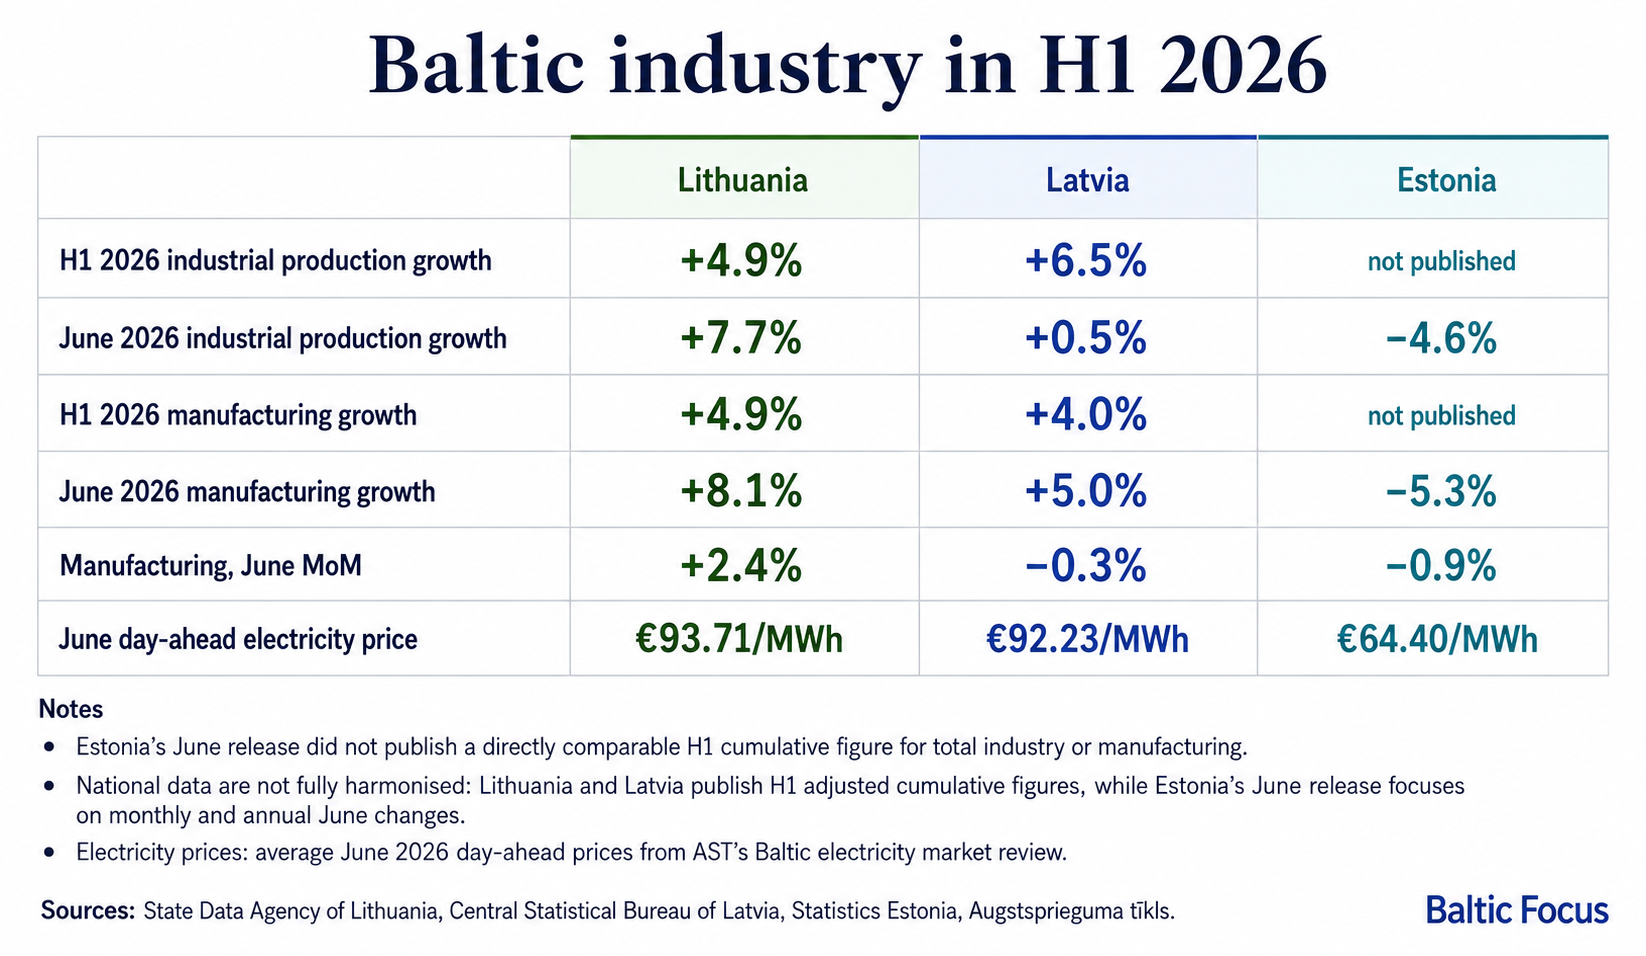
Lithuania’s manufacturing output rose by 8.1% year on year in June, Latvia recorded 5.0% growth, while Estonia posted a 5.3% decline. The latest data show the three Baltic manufacturing sectors entering the second half of 2026 on increasingly different trajectories.
June strengthened a divergence already visible in the previous Baltic Focus industrial checkpoint.
Lithuania moved from relatively moderate growth to the strongest manufacturing performance in the region. Latvia retained positive manufacturing momentum despite a sharp decline in electricity and gas supply. Estonia, meanwhile, recorded a fifth consecutive month of falling manufacturing output.
| June 2026 | Lithuania | Latvia | Estonia |
|---|---|---|---|
| Total industrial production, year on year | +7.7% | +0.5% | −4.6% |
| Manufacturing, year on year | +8.1% | +5.0% | −5.3% |
| Manufacturing, month on month* | +2.4% | −0.3% | −0.9% |
*Seasonally and working-day adjusted data.
The comparison does not describe one common Baltic industrial cycle. Lithuania is expanding, Latvia’s manufacturing sector remains positive but uneven, and Estonia has returned to a broader contraction.
Lithuania’s growth extends beyond oil refining
Lithuanian industrial production increased by 7.7% year on year in June and by 2.1% compared with May. Manufacturing rose by 8.1% year on year and by 2.4% over the month.
The result was not driven solely by refined petroleum products. Manufacturing excluding oil refining increased by 8.7% year on year in June and by 5.5% in the first half of 2026.
Production of capital goods rose by 11.8% year on year, durable consumer goods by 9.8% and intermediate goods by 9.1%.
Pharmaceutical production increased by 17.6% compared with May, while production of other transport equipment rose by 8.1%.
For January–June, Lithuania’s total industrial production and manufacturing output were both 4.9% higher than during the same period of 2025.
Latvia’s headline was held down by energy
Latvia’s total industrial production increased by only 0.5% year on year in June. That headline, however, conceals a considerably stronger manufacturing result.
Manufacturing output rose by 5.0%, while electricity and gas supply declined by 29.8%. Compared with May, total industrial production fell by 0.8% and manufacturing by 0.3%.
Growth was recorded in several important industries:
- chemical production: +52.2%;
- metal products: +19.0%;
- computers, electronic and optical equipment: +17.3%;
- machinery and equipment: +9.7%;
- food production: +5.7%;
- electrical equipment: +3.9%.
The largest Latvian manufacturing industry, wood processing, remained slightly below the previous year’s level, declining by 1.1%.
Manufacturing turnover increased by 6.0% year on year in current prices. Export turnover rose by 7.7%, compared with 2.9% growth in the domestic market.
During January–June, Latvian industrial production increased by 6.5% and manufacturing by 4.0%. The first-half figures therefore remain positive even though the June monthly movement weakened.
Estonia’s decline broadened further
Estonian industrial production fell by 4.6% year on year in June, while manufacturing declined by 5.3%.
The contraction was not limited to one industry. Wood processing fell by 2.0%, food production by 3.3%, metal products by 1.5%, and computers, electronic and optical equipment by 13.2%.
Manufacturing output has now declined for five consecutive months. Food production has contracted for six months in a row.
Compared with May, total industrial production fell by another 2.3% and manufacturing by 0.9%.
Export sales offered a more mixed signal. Manufacturing sales to foreign markets increased by 2.6% in current prices, while domestic sales declined by 4.4%.
This suggests that export revenue has held up better than physical production volumes, but it does not yet indicate a recovery in output.
Cheaper electricity has not reversed Estonia’s industrial decline
The Estonian result is particularly notable because the country retained the lowest wholesale electricity price in the Baltic region.
According to AST’s June 2026 Baltic electricity market review, average day-ahead prices were:
| Bidding area | Average price |
| Estonia | €64.40/MWh |
| Latvia | €92.23/MWh |
| Lithuania | €93.71/MWh |
Estonian electricity was therefore approximately one-third cheaper than in Latvia and Lithuania. Nevertheless, Estonian manufacturing contracted while manufacturing output increased in both neighbouring countries.
This does not mean that electricity prices are unimportant. A wholesale market price is not the final electricity cost faced by every industrial consumer. Contracts, hedging, network charges, taxes, balancing costs and consumption profiles all affect the actual bill.
The comparison does show, however, that electricity alone cannot explain the widening Baltic industrial gap.
Estonia’s changing cost structure
Commenting on the May industrial data in July, Swedbank chief economist Tõnu Mertsina identified competitiveness as the weak point of Estonian manufacturing.
He has also pointed to the pressure created when labour costs rise faster than productivity, alongside weaker external demand, higher input costs and uncertainty in international supply chains.
The relevant question is not whether Estonian production equipment has suddenly become obsolete.
Production lines that were sufficiently productive under an earlier cost structure may no longer produce enough output or value to absorb higher labour, tax and other operating costs.
Many manufacturing activities were originally located in Estonia because the country offered a favourable overall production base close to Nordic markets. The attraction was not necessarily superior machinery. It was the combination of labour costs, taxation, logistics, business conditions and access to customers.
The machinery may still work. The economics of the location may have changed.
Estonia is also entering a period of substantially larger fiscal and defence commitments. Part of the higher defence investment will be financed through up to €2.34 billion in long-term EU SAFE loans, reducing the immediate budget impact but extending the state’s commitments over time.
This does not establish a direct link between defence spending, taxation and the industrial decline.
It does raise a broader question: whether manufacturing productivity is increasing fast enough to absorb Estonia’s changed cost structure.
The Baltic picture
June produced three distinct industrial signals.
Lithuania recorded broad manufacturing growth, including capital and intermediate goods. Latvia’s manufacturing sector continued to expand despite a major negative contribution from electricity and gas supply. Estonia’s decline spread across several of its major manufacturing industries even as it retained the most favourable wholesale electricity price in the region.
The result is not simply a ranking of three monthly figures.
It is a widening difference between three production trajectories operating inside one Baltic market:
- Lithuania entered the summer with the strongest and broadest manufacturing expansion;
- Latvia retained manufacturing growth, but with weaker monthly momentum and uneven sectoral results;
- Estonia remained caught between a comparatively favourable electricity market and a cost structure that may be rising faster than manufacturing productivity.
The next industrial releases will show whether Lithuania’s June acceleration can be sustained, whether Latvia’s positive manufacturing trend survives the monthly slowdown, and whether Estonia can interrupt a contraction that has now extended through five consecutive months.
Sources: State Data Agency of Lithuania; Central Statistical Bureau of Latvia; Statistics Estonia; Augstsprieguma tīkls; Swedbank Estonia; ERR.
Primary source
State Data Agency of Lithuania; Central Statistical Bureau of Latvia; Statistics Estonia
Industrial production data for June 2026