Baltic trade in May 2026: energy lifted the headline, but the underlying export picture diverged
Goods exports increased in all three Baltic states in May 2026.
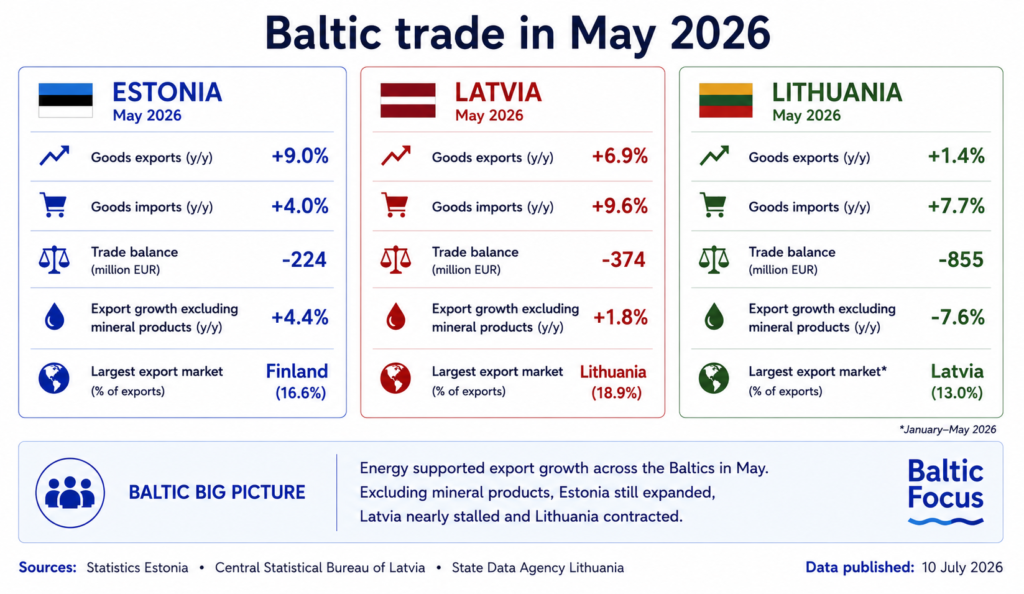
Goods exports increased in all three Baltic states in May 2026. Estonia recorded annual growth of 9%, Latvia 6.9%, and Lithuania 1.4%.
Taken at face value, these figures suggest that Baltic trade continued to expand after the strong results recorded in April. But the common headline conceals a much less uniform regional picture.
Mineral products were a major source of export growth in all three countries. Once this component is removed, Estonia still shows moderate expansion, Latvia is close to stagnation, and Lithuania moves into clear contraction.
| May 2026 | Estonia | Latvia | Lithuania |
| Goods exports | €1.72bn | €1.74bn | €3.11bn |
| Annual export change | +9.0% | +6.9% | +1.4% |
| Goods imports | €1.95bn | €2.12bn | €3.97bn |
| Annual import change | +4.0% | +9.6% | +7.7% |
| Trade balance | -€224m | -€374m | -€855m |
| Export growth excluding mineral products | approx. +4.4% | approx. +1.8% | -7.6% |
The estimates for Estonia and Latvia are calculated from the total export value and the published value and annual change of mineral-product exports. Lithuania’s State Data Agency publishes the figure excluding mineral products directly. Because the national statistical releases do not provide completely identical decompositions, the adjusted figures should be treated as analytical estimates rather than a harmonised official Baltic indicator.
The comparison nevertheless changes the regional ranking substantially. Energy-related trade supported all three headline figures, but underlying export performance ranged from continued growth in Estonia to near-stagnation in Latvia and a marked decline in Lithuania.
Estonia: underlying exports continued to grow
| MAY 2026 | ESTONIA | |
| Goods exports / imports | €1.72bn / €1.95bn |
| Annual export change | +9.0% |
| Annual import change | +4.0% |
| Trade balance | -€224m (from -€287m) |
| Exports excluding mineral products | approx. +4.4% |
This indicates that Estonia recorded the broadest underlying export growth among the three Baltic states in May.
The distinction between domestic exports and re-exports remains important. Re-exports increased by 15%, while exports of Estonian-origin goods rose by 5%. Estonian-origin goods accounted for 62% of total exports, down from 64% a year earlier.
The strongest increases among Estonian-origin goods were recorded in machinery and electrical equipment. Exports of wood and wood products, as well as agricultural and food products, declined.
Estonia’s trade also shifted further towards the European Union. Exports to EU countries increased by 13%, while exports to non-EU countries fell by 3%. Imports from the EU rose by 9%, while imports from outside the EU declined by 16%.
Part of the decline in extra-EU imports reflected a high comparison base created by large defence-related transactions in May 2025.
Finland remained Estonia’s largest export and import partner. Latvia and Lithuania were the second- and third-largest export destinations. On the import side, Finland accounted for 13%, followed by Latvia, Germany and Lithuania, each with approximately 10%.
Estonia therefore combined three comparatively favourable signals: exports excluding mineral products continued to grow, the trade deficit narrowed and EU-oriented trade expanded. The main qualification is that re-exports grew substantially faster than exports of Estonian-origin goods.
Latvia: solid headline growth, weak growth beneath the energy component
| MAY 2026 | LATVIA | |
| Goods exports / imports | €1.74bn / €2.12bn |
| Annual export change | +6.9% |
| Annual import change | +9.6% |
| Trade balance | -€374m (from -€301m) |
| Exports excluding mineral products | approx. +1.8% |
For January–May, exports increased by 3.5%, while imports rose by 6.7%.
Mineral products were the main driver of the May export increase. Their export value rose by €86.3 million, or 59.8%. Exports of machinery, mechanical equipment and electrical equipment increased by €28.9 million, while plant products and processed food also contributed positively.
This does not indicate outright contraction, but it shows that the underlying expansion was considerably weaker than the headline figure suggests.
The composition was mixed. Wood and wood products, Latvia’s largest individual export category, were almost unchanged from a year earlier. Exports of base metals declined, while electrical equipment and several food-related groups expanded.
On the import side, mineral products increased by €112.6 million, or 56%. Imports of electrical equipment, transport equipment and base metals also rose.
Latvia’s Ministry of Economics described the result as a continuation of stable export growth and interpreted the 10.7% increase in exports to EU countries as evidence of a gradual recovery in European demand.
That diagnosis is plausible, but the data do not yet demonstrate a broad recovery in external demand. The increase remained heavily supported by mineral products, while imports continued to grow faster than exports.
Latvia’s trading geography was strongly regional. Lithuania was its largest export market, accounting for 18.9% of exports, and its largest import source, with 22.5%. Estonia represented 10.6% of exports and 10% of imports.
The same relationship is visible from the neighbouring countries. Latvia was Lithuania’s largest export market during January–May and one of Estonia’s three largest export destinations. It was also a significant source of imports for both countries.
This high degree of mutual trade supports the working hypothesis that Latvia functions as an important intra-Baltic trading node. Partner shares alone, however, cannot establish whether this reflects logistics, distribution, re-export activity, energy flows, or final demand. That would require a separate examination of commodity flows and re-export structures.
For the May reading, the safer conclusion is narrower: Latvia was more strongly embedded in trade with both Baltic neighbours than either Estonia or Lithuania was with the other two simultaneously.
Lithuania: growth disappeared once mineral products were removed
| MAY 2026 | LITHUANIA | |
| Goods exports / imports | €3.11bn / €3.97bn |
| Annual export change | +1.4% |
| Annual import change | +7.7% |
| Trade balance | -€855.2m (from -€615.5m) |
| Exports excluding mineral products | -7.6% |
Lithuania remained by far the largest Baltic trading economy by volume, but it also showed the weakest underlying export performance.
The picture was even weaker for domestically produced goods. Exports of Lithuanian-origin goods increased by 1%, but declined by 12.6% when mineral products were excluded.
This makes Lithuania the clearest example of why the headline export rate is insufficient to assess the state of the productive economy.
For January–May, total exports increased by 3%, while imports rose by 2.4%. Exports of Lithuanian-origin goods grew by 1.7%, but declined by 2.8% excluding mineral products.
The weakness was therefore not confined to a single monthly comparison.
Mineral products accounted for 17.1% of total exports during January–May. Machinery and electrical equipment represented 13.7%, while chemical products accounted for 11.2%.
Among Lithuanian-origin goods, mineral products represented 21.1% of exports. Prepared food, beverages and tobacco accounted for 10.4%, machinery and electrical equipment for 10%, and furniture and related products for 9.9%.
Latvia was Lithuania’s largest export destination during the first five months of 2026, accounting for 13% of total exports. Poland was the largest source of imports, with 13.9%, followed by Germany at 12.7% and Latvia at 8.5%.
Lithuania’s May result therefore combined large trade volumes with weak underlying export momentum. The positive headline depended heavily on the mineral-products component, while non-mineral and domestic-origin exports showed a substantially less favourable trend.
What the divergence means
The May data do not support a simple story of either a Baltic export recovery or a Baltic trade slowdown.
Instead, they show three different levels of resilience beneath a shared energy-related impulse.
Estonia retained moderate export growth after mineral products were excluded. Latvia’s adjusted growth was marginal. Lithuania’s non-mineral exports contracted sharply.
This matters because mineral-product trade can move with energy prices, refining activity, electricity flows, and cross-border distribution. It may lift the nominal value of exports without producing an equivalent expansion across the broader manufacturing base.
The result is a regional trade cycle that looks more synchronised in the headline figures than in the underlying data.
For investors and analysts, the next test is therefore not simply whether total Baltic exports continue to rise. It is whether non-mineral exports, domestic-origin production and machinery-related trade begin to converge again over the coming months.
If they do not, the region may continue to report positive aggregate trade growth while its national industrial cycles move in different directions.
Baltic big picture: Energy supported all three Baltic export figures in May, but beneath that common layer Estonia expanded, Latvia nearly stalled and Lithuania contracted.
Sources: Statistics Estonia; Central Statistical Bureau of Latvia; Ministry of Economics of Latvia; State Data Agency of Lithuania. Data published on 10 July 2026.